
President Biden’s Infrastructure and Build Back Better Plans: An Antidote for Inflationary Pressure
By Jared Bernstein and Ernie Tedeschi
President Biden, referring to the infrastructure and Build Back Better agendas: “If your primary concern right now is inflation, you should be even more enthusiastic about this plan.”
Debate over President Biden’s infrastructure and Build Back Better (BBB) plans is ramping up. One question is how the packages will affect inflation and economic heat. The infrastructure and Build Back Better plans are designed to be long-term packages that increase the capacity of the economy through investments in physical infrastructure, human capital, clean energy, housing, and health care. Such investments, as discussed below, should be expected to have little, if any, effect on inflationary pressures in the short-term and to ease them over the long term. In addition to increasing capacity, other factors that push against the inflationary effects of these investment plans include the sharp reversal of fiscal impulse, as well as the plans’ “payfors,” i.e., revenues raised or expenditures cut to offset the costs of the measures.
Forthcoming Fiscal Drag
Congress is considering the infrastructure and BBB packages in a fiscal and economic backdrop that is likely to look very different over the next few years from the last year and a half. This point requires an explanation of “fiscal impulse,” or the impact of yearly changes in government spending on economic growth, jobs, and prices. Fiscal impulse can be positive, neutral, or negative depending on whether government spending or revenue is increasing, stable, or decreasing. If, for example, fiscal outlays went up by $1 trillion last year and $500 billion this year, this would constitute a “negative fiscal impulse” and a drag on growth, even though we spent $500 billion on top of last year’s trillion because of the decrease in spending. The key takeaway here is that the change in fiscal support determines the growth impulse, not the level.
As spending from the American Rescue Plan and earlier relief packages ramp down relative to earlier levels—even including the new spending from the two plans now under Congressional consideration—fiscal impulse is about to go from strong positive to significant negative. A simple way to measure fiscal drag is to look at the change in the primary (non-interest) deficit as a share of GDP: a positive number shows a growing deficit and thus, fiscal support; a negative number shows a shrinking deficit and drag.[1] Our estimate is that positive Federal fiscal support came to 10 percentage points of GDP in 2020 and 2 percentage points in 2021. But in 2022 under current law, support will flip to 9 percentage points of drag, the largest fiscal headwind since the demobilization from World War II in 1946 (see left panel of the figure below). The infrastructure and BBB packages only slightly alleviate near-term fiscal drag: 2022 drag is 0.4 percentage points lower with their passage, or around 5 percent smaller (see right panel of figure). Over the next 10 years, average annual drag is virtually identical with or without passage.
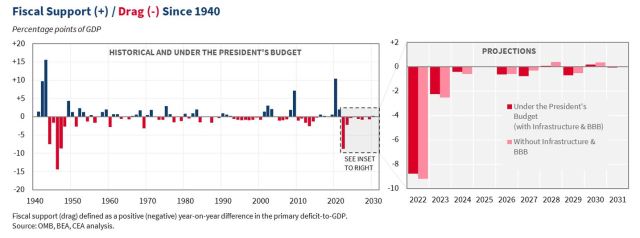
We view this as a feature, not a bug, of the timing and effectiveness of the Rescue Plan, which did—and continues to do—precisely what President Biden intended. By getting shots in arms and checks in pockets, the Rescue Plan was designed to help families and businesses make it to the other side of the crisis and allow people to safely re-engage with commerce, thereby pulling forward a robust recovery beginning well before forecasters expected. The Rescue Plan continues to provide essential resources to states and school systems dealing with the rise of the Delta variant. But, this also means that those raising the possibility of overheating of the economy (which would generate inflation) must recognize that even with the new plans, fiscal policy will likely be a drag on growth next year, as shown in the above figure.
A key factor behind these fiscal timing dynamics relates to the different cadences with which the Rescue Plan and the investment plans spend out their resources. The front-loaded relief spending in the Rescue Plan—fast-acting direct checks to households, enhanced unemployment insurance benefits, and grants to businesses hit by the pandemic—was designed to spend out much faster than the infrastructure and BBB plans are expected to spend out. We estimate that ARP fiscal support will come to about 7.5 percent of GDP in its first year, 2021. In contrast, in their first year (2022), we expect the infrastructure and BBB plans to spend out just over 0.5 percent of GDP. This reflects both the longer timeline of infrastructure spending as well as the fact that the infrastructure and BBB plans are paid for through revenue increases. This means that these plans generate less deficit spending than would occur without the payfors, which would, in turn, facilitates the shift from positive to negative fiscal impulse.
Depending on when these plans pass, they will start creating good jobs right out of the gate—hopefully beginning later this year and early next year. But, the fact that they ramp up over time and spend out over a decade must be factored into any assessment of the near-term heat these plans will generate.
Boosting the Economy’s Capacity
The next, and in some ways, most important difference between the Rescue Plan and the infrastructure and BBB plans, relates to their respective economic purposes and approaches. The ARP was primarily (though, not exclusively) a temporary, “demand-side” package designed to fund widespread vaccinations while helping families, businesses, states, localities, and schools weather the economic storm wrought by the pandemic.[1] In contrast, most measures in the infrastructure plan and BBB agenda aim to more permanently boost what economists call the economy’s “capacity,” or “supply-side.”
Capacity can expand for a number of different reasons. We may get more workers, either because we have more people in the first place (due to, say, an increase in fertility or immigration), or because the people we already have become more likely to work (an increase in labor force participation). Each worker may also become more productive on average as a result of education and skills training, access to better equipment and infrastructure (“capital deepening”), or general innovation and technology advances (“total-” or “multi-factor productivity”).
The President’s investment plans expand the capacity of the U.S. economy through a number of these different channels. For example, the transportation, rail, public transit, and port investments will reduce efficiency-killing frictions that keep people and goods from getting to markets as quickly as they should. The child and elder care investments will boost the labor supply of caretakers. The educational investments in pre-K and community college will eventually show up as higher-productivity as a result of a better-educated workforce.
Larger capacity and faster growth pay dividends to people over the long run in different ways. Key benefits include higher incomes on average and greater economic security. Another is lower inflationary pressure: as economic capacity builds, cost pressures are less binding on firms making new goods and services, and price pressures gradually ease. In the late 1990s, for example, productivity in the U.S. accelerated due in large part to the rise of the Internet and the adaption of other information technology, meaning the capacity of the U.S. economy was growing faster than economists had previously expected. At the time, the Federal Reserve led by its Chair, Alan Greenspan, recognized that this unexpected expansion in the supply-side meant that inflationary pressure would be lower than anticipated; in turn, the Federal Reserve adjusted its outlooks accordingly.
Conclusion
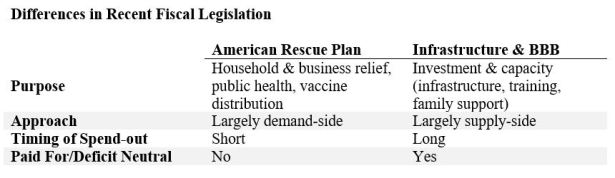
We understand that policymakers must be mindful of the impact of their decisions on the price pressures we have seen in recent months. And, it is true that some of these measures are likely to generate demand in areas like construction, where materials and labor have, of late, shown transitory supply-constraints. But, as the table above shows, the infrastructure and BBB plans have salient differences from the Rescue Plan, and these differences have impactful implications for their inflationary effects. When we account for fiscal impulse, spend-out timing, new revenue, and the boosts to the economy’s supply-side, the economics behind the President’s investment agenda strongly support his assertion that those worried about inflation right now should embrace these plans.
[1] One important supply-side component of the ARP however was the funding for vaccine research and distribution.
[1] We use this definition for simplicity but there are others as well. Some fiscal drag estimates filter out automatic stabilizers (income support programs that naturally kick in during downturns, such as unemployment insurance (UI)). Some express drag relative to potential rather than actual GDP, and some apply different fiscal multipliers that distinguish between different types of fiscal support.