
The Signal and the Noise, Part II: CPI Inflation
In a recent blog, we discussed the importance of different measurement approaches to pulling the economic signal from noisy monthly jobs data. In this post, we do the same for monthly CPI inflation. Typically, inflation reports and their media coverage focus on two numbers: the monthly change and the yearly change. This morning we learned, for example, the April inflation was 0.4 percent since March and 4.9 percent since last April. As the figure below shows, yearly inflation has declined since its most recent peak in June of last year, when it was 9.1 percent. The fact that the yearly rate has come down 10 months in a row and is down 4.2 percentage points from this peak is a good sign that we are headed solidly in the right direction, though price growth is still clearly elevated relative to pre-pandemic levels.
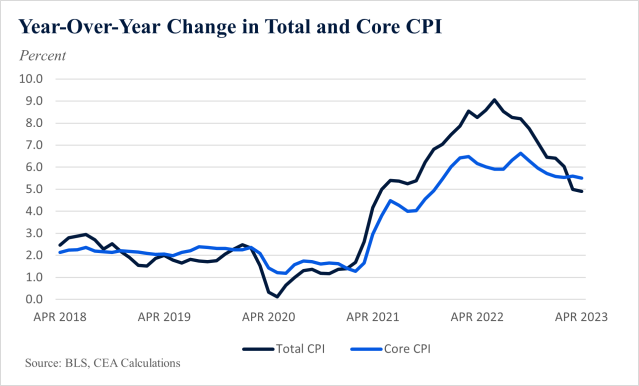
As we have said in many contexts, monthly changes, while informative, tend to be too noisy to provide a clear signal of the data’s underlying trend. Yearly changes are better for that purpose, but they can go too far in the other direction: they underweight changes in recent months that give analysts a more up-to-date take on the current trend in inflation.
One solution is to look at 3-month annualized changes, meaning the growth rate of prices over the past three months, measured on an annualized basis (that is how much prices would change if the most recent 3-month pace persisted for 12 months). The figure below shows overall and core CPI inflation (which leaves out food and energy) on this 3-month, annualized basis.
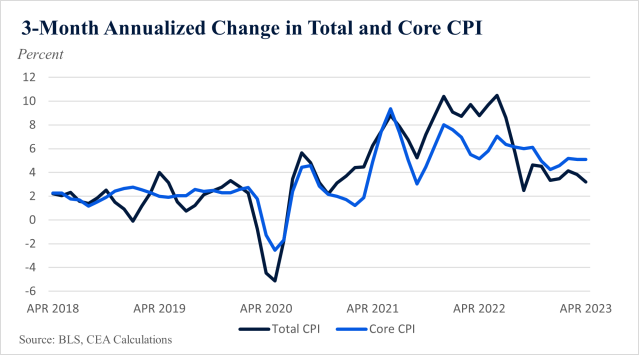
The figure shows that overall CPI inflation has come down significantly from its peak last summer. Its 3.2 percent rate in April is the slowest 3-month annualized growth rate since September 2022. Core inflation, however, remains elevated and has been “stickier.”
A final approach to extracting signal from noise in the inflation data combines all of the above insights into a bar chart that looks at annualized changes on a 12, 6, 3, and 1-month basis. As a gauge of how the profile of inflation’s pace has evolved over the past year, we find it useful to compare the most recent set of bars to the set from a year ago, as in the figure below.
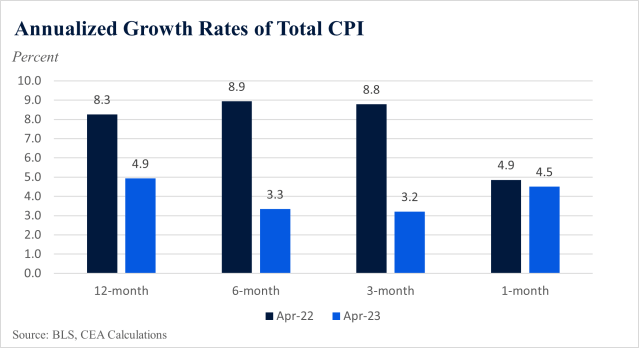
Starting with the bars from today’s data, we see smaller growth rates at 6- and 3-month intervals than at the yearly (12-month) interval, suggesting inflation has slowed in recent months. However, the one-month rate (today’s 0.4 percent, annualized) jumps up a bit, a reminder that the noisier monthly data can be harder to read, trend-wise. The figure also shows that CPI inflation is a lot lower at least at the 12, 6, and 3-month intervals this April than it was in April 2022.
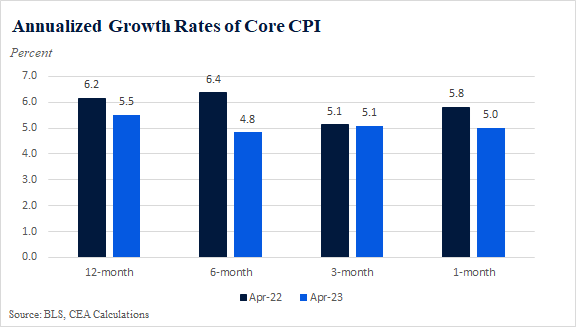
This next figure shows a similar analysis for core CPI inflation. At 12, 6, and 1-month intervals, core CPI inflation is lower this year than last, but in all cases the bars are elevated, and there is little evidence of slower price growth at shorter frequencies, underscoring the point that core inflation still remains too high and stickier than the overall index.
In sum, on an annual or on a timelier 3-month basis, overall CPI inflation is slowing, and not just for a month or two, but on a more persistent trend basis. The rate of inflation remains elevated, but progress is clearly underway. Core inflation, however, has been stickier than the overall measure.