The Employment Situation in June
By Chair Cecilia Rouse
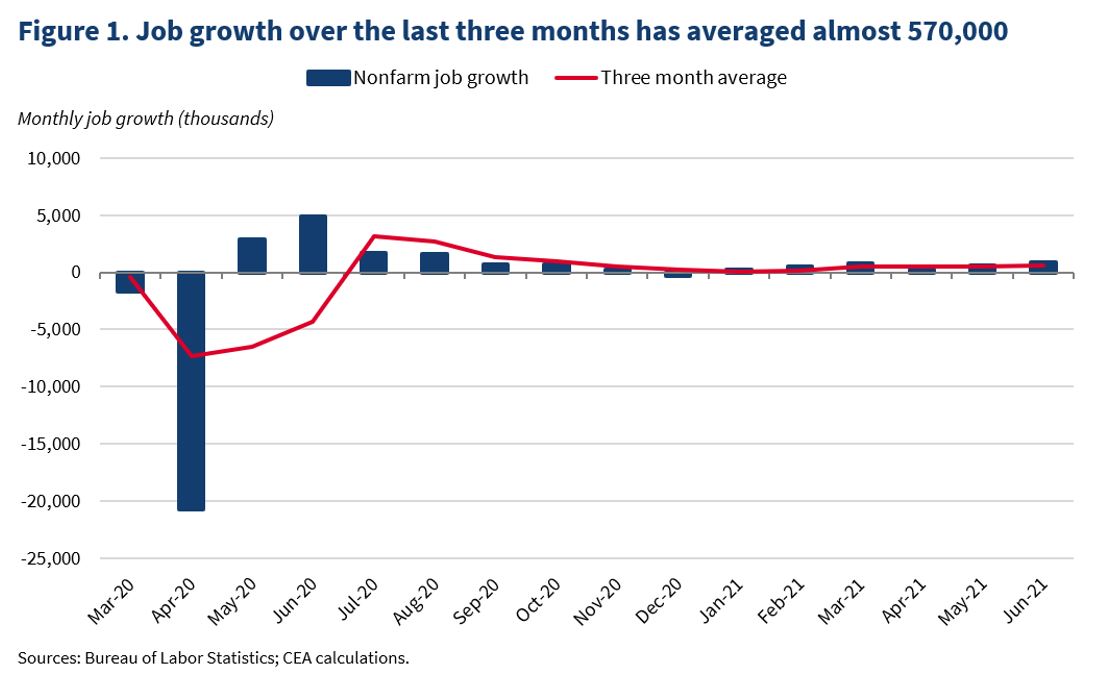
Today’s jobs report showed the economy added 850,000 jobs in June, for an average gain of 567,000 over the last three months. This is the fastest monthly job growth since August of last summer. In addition, the unemployment rate ticked up, and the labor force participation rate held steady.
- The three-month average of job growth was about 567,000, roughly the same as it has been for the last few months, showing strong job growth.
Average job growth is currently 567,000 jobs a month (see Figure 1). It is important to pay attention to this three-month moving average to understand the trend, rather than focusing on the data in a single month since monthly numbers can be volatile. Smoothing out the volatility continues to show strong job growth as the economy recovers.

However, our economy still has not fully recovered as employment remains about 6.8 million jobs below its pre-pandemic level.
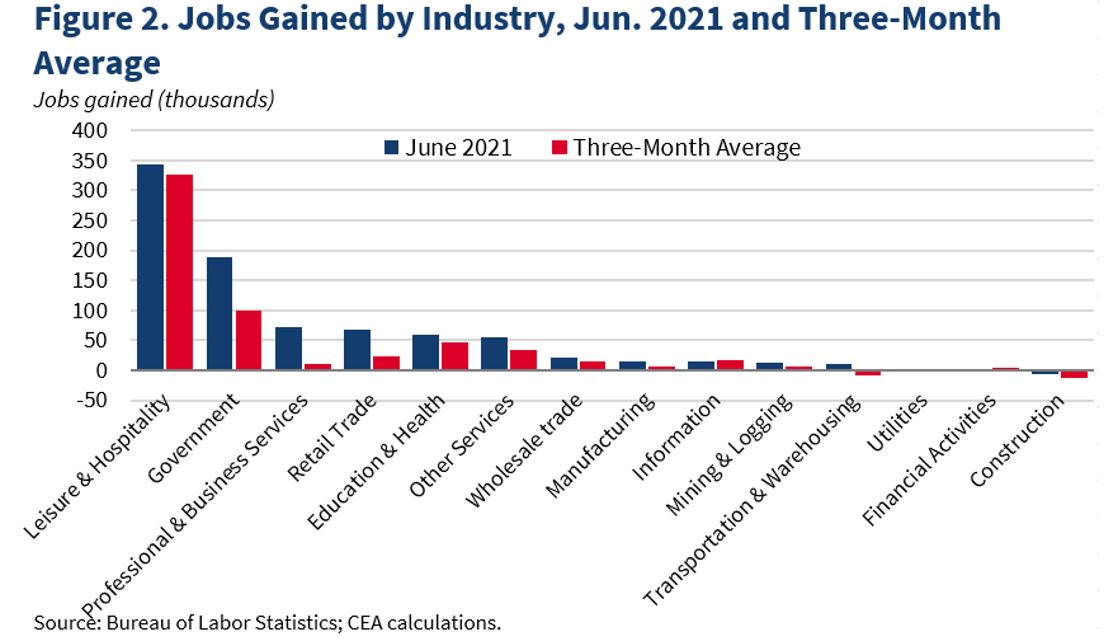
2. The strong job growth in June was again driven by leisure and hospitality, with additional solid gains in government and retail.
Leisure and hospitality added 343,000 jobs in June, by far the most of any industry (see Figure 2). It has led job growth for the last five months. Government added 188,000 jobs overall; within government, State and local education added 230,000 jobs, although State and local government employment outside of education lost 37,000 jobs. Government employment is still one million jobs below where it was pre-pandemic. In addition, temporary help services added jobs in June–often a leading indicator of future employment growth. However, the sector lost jobs in the previous two months.
Looking at the three-month average, leisure and hospitality has added 326,000 jobs on average over the last three months. Government has added about 100,000 jobs on average.

3. The pandemic has disrupted traditional seasonal patterns of hiring.
In a normal economy, non-seasonally adjusted job growth in one month is not predictive of hiring in the next since there may be fluctuations due to seasonal differences. For example, while the economy usually adds some jobs in June non-seasonally adjusted, it usually loses millions of jobs in July as local education in particular sheds jobs as the school year ends. So, June does not predict July. These seasonal patterns are not of macroeconomic concern since the labor market eventually evens out. Thus, the Bureau of Labor Statistics adjusts these numbers so that we can analyze hiring trends accounting for typical seasonal patterns.
For example, State and local education hired fewer people for the past school year given Covid restrictions, and laid off workers earlier than normal due to school closures. Typically, this sector sees layoffs in the summer, when fewer school employees are needed. But since the numbers were already low due to earlier layoffs, there were fewer people to let go. In addition, a shift in the school-year in some districts as schools attempted to make-up for Covid-related learning disruptions could have impacted the typical seasonal pattern relative to the reference week. The increase in jobs, therefore, is partly a reflection of the fact that fewer people were laid off, not that more were hired. This information is important to note in order to fully understand how hard it is to interpret seasonal factors in the pandemic-affected economy.
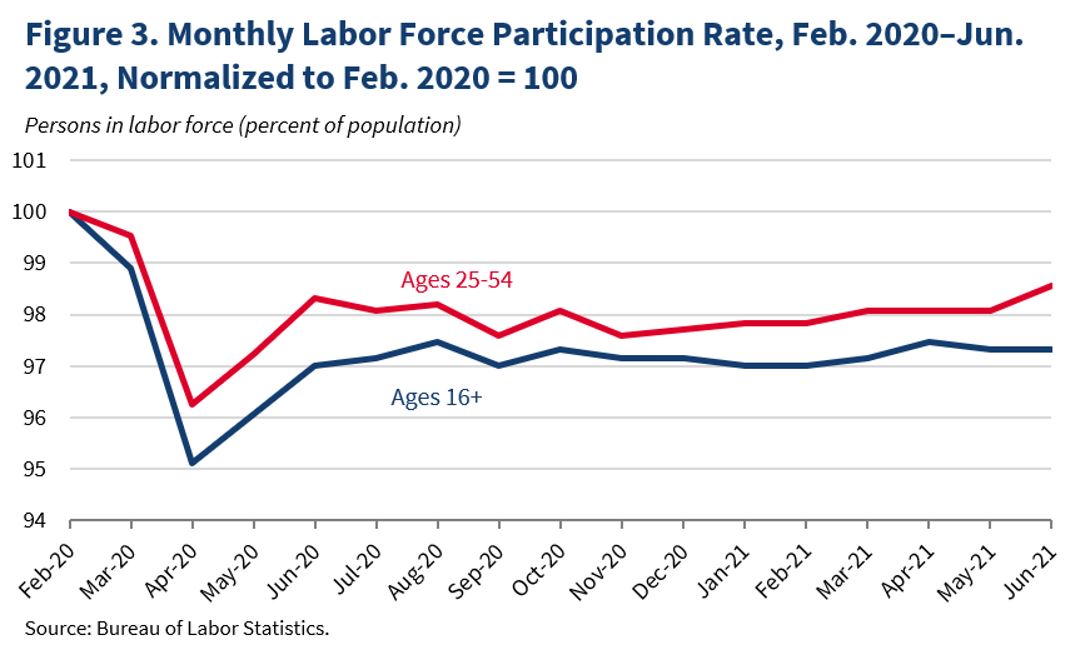
4. Labor force participation held steady at 61.6 percent. Labor force participation can bounce around month-to-month but has been about 61.6 percent for the last three months.
While labor force participation usually falls in U.S. recessions, this recession has been unusual in its labor force declines. Lingering concerns about contracting Covid, lack of child care, and school disruptions have prevented many from participating in or reentering the labor market.
In June, the overall labor force participation rate held steady at 61.6 percent (see Figure 3). This flatness reflects different outcomes for different age groups. The prime-age (25 to 54) labor force participation rate increased by 0.4 percentage points to 81.7 percent. (Figure 3 has normalized the participation rate for both age groups to 100 in February 2020 to make the patterns during the pandemic easier to see).
Looking at ages 25 to 54 helps account for the impact on the labor force participation rate of retirements and the aging of the population. While this is always important, it is particularly of note now given the increase in retirements during the pandemic. Meanwhile, the participation rate among teenagers declined; their participation has been relatively high during the pandemic.

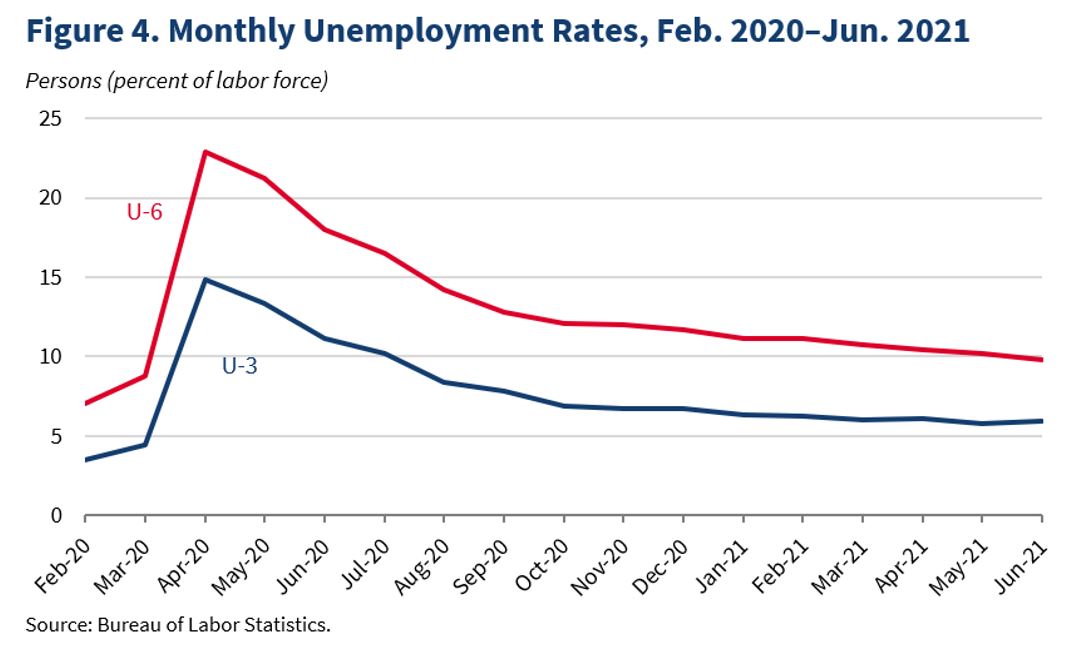
5. The unemployment rate ticked up to 5.9 percent, but a broader measure of unemployment fell below 10 percent for the first time in the pandemic.
The headline unemployment rate ticked up to 5.9 percent (see Figure 4). However, a broader measure of unemployment (U-6)—which includes people who are working part-time for economic reasons (people who are working part-time but would prefer to work full-time) and people who are out of the labor force (but would like a job)—fell to its lowest rate in the pandemic and below 10 percent for the first time since the pandemic began. The decline in U-6 primarily reflected the more than 600,000 people who were no longer working part-time for economic reasons in June.

As the pandemic has stretched on, long-term unemployment has increased. About 42 percent of the unemployed are long-term unemployed (27 weeks and over). This is lower than it was in April, but higher than it was in May. Pre-pandemic, it was about 20 percent. In June, 2.9 million people were ultra long-term unemployed (52 or more weeks, this number is not seasonally adjusted), about 250,000 more than in May. The ultra long-term unemployed are more likely to be Black or Hispanic than one would expect from the Black and Hispanic share of the labor force. White workers are less likely to be ultra long-term unemployed than one would expect, while the Asian worker share of the ultra long-term unemployed is roughly proportionate to their share of the labor force.
As the Administration stresses every month, the monthly employment and unemployment figures can be volatile, and payroll employment estimates can be subject to substantial revision. Therefore, it is important not to read too much into any one monthly report, and it is informative to consider each report in the context of other data as they become available.

