
An Update on Housing Inflation in the Consumer Price Index
The dynamics around inflation have shifted in important ways over the past year. From June 2022 to March 2023, annual Consumer Price Index (CPI) inflation dropped from 9.1 percent to 5.0 percent. Two major factors that were the main drivers of inflation have eased: energy and core goods. The contribution to inflation from energy prices—which are notoriously volatile—has decreased in recent months and was even negative in March on a year-on-year basis (see Figure 1). In addition, the improvement in supply chains is evident in the diminished contribution of core goods inflation, a favorable trend over the past few quarters.

In contrast, however, housing’s contribution to inflation has significantly increased. Housing now accounts for a third of the consumer basket of items measured in CPI, so even small increases can have an outsized impact on inflation.[1] Last June, housing accounted for a fifth of inflation, contributing 1.7 percentage points. By March 2023, housing’s contribution rose to 2.6 percentage points, making up half of annual CPI inflation. For perspective, before the pandemic housing would typically contribute about 1 percentage point to inflation.[2]
Along with some outside analysts, we see evidence that housing inflation could ease in the coming months. Here, we review why housing inflation rose in the first place and how the CPI’s measurement of housing prices may influence their potential path going forward.
Recent housing inflation appears to have roots in both demand and supply factors. Mondragon & Wieland (2022) and Kmetz et al (2022) emphasize pandemic demand channels such as rises in both internal migration and work from home (WFH) arrangements. The geographic flexibility of WFH may affect where working-age families want to live and may also affect how much space and what types of housing they demand. It is uncertain, however, how persistent this pandemic shift in demand will last.
Furthermore, this higher demand mixed with long-running housing supply constraints in some metropolitan areas, exacerbating price increases. The Biden Administration has made increasing the supply of affordable housing a top priority, responding with, for example, the Housing Supply Action Plan, which incentivizes land use and zoning reform and finances new construction, as well as the President’s latest Budget, which proposes more than $175 billion in housing investments over the next 10 years.
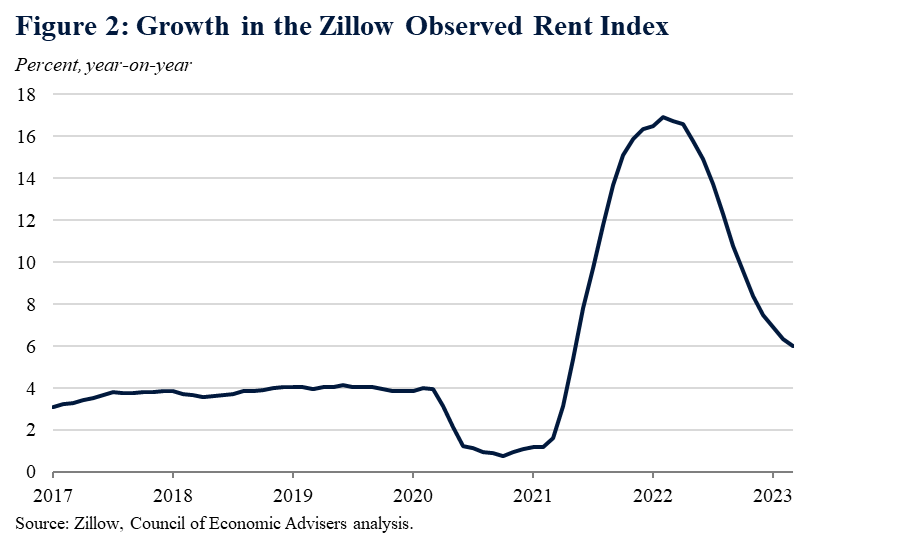
Several measurement issues also affect the official housing inflation statistics. Market data such as Zillow’s show that growth in the price of newly-signed leases is still elevated but has slowed considerably since last year, suggesting that the rental market is cooling (see Figure 2). Importantly, however, CPI will not fully reflect such a slowdown immediately. That’s in part because CPI measures both new and existing leases. Existing leases generally do not update frequently—perhaps once or twice a year—so they take time to reflect current market dynamics. These measurement issues also affect how CPI estimates owners’ equivalent rent: the monthly value of housing services received by homeowners. Because official inflation data only reflect housing dynamics with a lag, many policymakers and private observers including CEA track housing and non-housing services separately when analyzing the components of overall inflation, as shown in Figure 1.
CEA models monthly CPI housing inflation using a population-weighted version of the Zillow median rent index to capture these lagged market pressures. Similar to a recent Bureau of Labor Statistics paper (Adams et al. 2022), CEA finds that it takes roughly 12 months for changes in market rents to become fully incorporated into housing CPI. Our model implies that the slowdown in market rental growth last year largely will not begin to show up in CPI until the second half of 2023 (see Figure 3), at which point we expect housing to broadly start contributing less to monthly CPI. A strong caveat to this is that any month can bounce one way or the other, as shown in the black line in the figure.
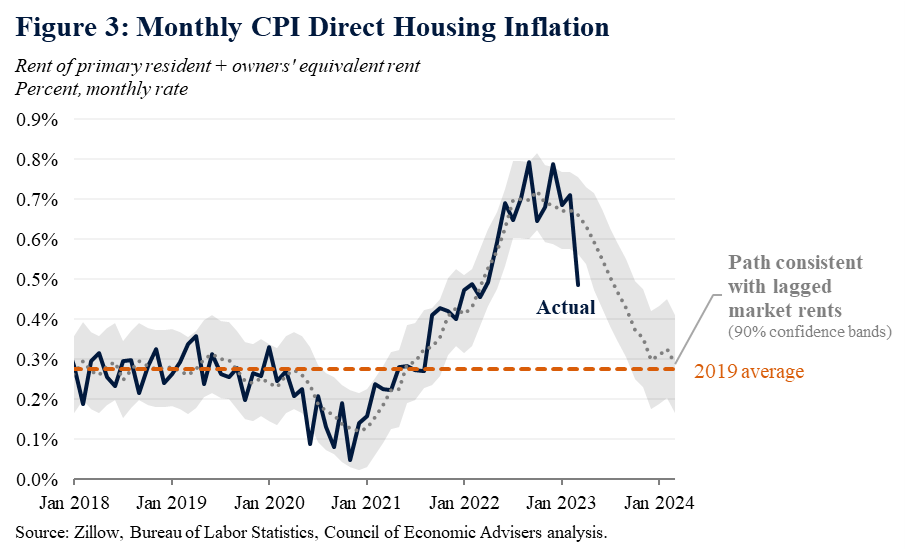
Interestingly, monthly CPI housing inflation in March was significantly weaker than the model predicted. While this would be welcome news if sustained, one month of data is too little to determine if this decline reflects actual developments or is just data noise. If the latter, housing inflation may partially or fully reverse in April.
In conclusion, overall inflation has cooled considerably since last June, but housing inflation remains high. In many areas of the country, this reflects both stronger pandemic demand and long-standing shortfalls of supply. Market data suggest that in recent months, rental growth has declined. According to our estimates, it will take some time—perhaps until later this year—but eventually we hope to see these declines reflected in official inflation data. CEA will continue to closely monitor this and other data developments as they occur.
[1] “Housing” in the context of this blog refers to the sum of two CPI categories: rent of primary residence and owners’ equivalent rent (OER).
[2] An important clarification is that “housing inflation” in CPI is not a measure of the change in housing purchase prices, at least not directly. Instead, the Bureau of Labor Statistics tracks the rental value of different housing units. For rental units, this is the price of new and existing leases. For owner-occupied units, BLS calculates the “owners’ equivalent rent,” an estimate of the amount that an owned unit would rent for based on lease prices of similar units.