
The July Consumer Price Index: It’s All About That Base (Effect)
Jared Bernstein, Chair of the Council of Economic Advisers
Consumer prices, as measured by the Consumer Price Index (CPI), rose 0.2 percent in July, at market expectations and the same pace as in June, and by 3.2 percent over the past year, slightly higher than June’s 3 percent. Prices for core goods (excluding volatile gas and food prices) rose 0.2 percent in July (also at market expectations and the same as June) and by 4.7 percent year-over-year, a tick down from June’s 4.8 percent. Due to “base effects”—explained below—it is particularly useful this month to consider the 3-month annualized rate of 1.9 percent for headline inflation, the lowest such rate since June 2020. The 3-month rate for core was 3.1 percent, its lowest such rate since September 2021.
To get under the hood of the report, see the CEA’s Twitter thread. In this post, I consider the Talmudic question: given the myriad choices, over which time period should we measure the CPI? That is, what different information do we glean from the different spans presented above?
Of course, there is no “right” answer. But that doesn’t mean it’s an arbitrary choice. In fact, there are good reasons for looking at differing timespans. When, as in recent months, there has been a trend reversal in a variable’s growth path, or when there is a base effect in play, it is useful to look at shorter spans. The figures below show headline and core inflation using both 12-month and 3-month annualized growth rates.[1]
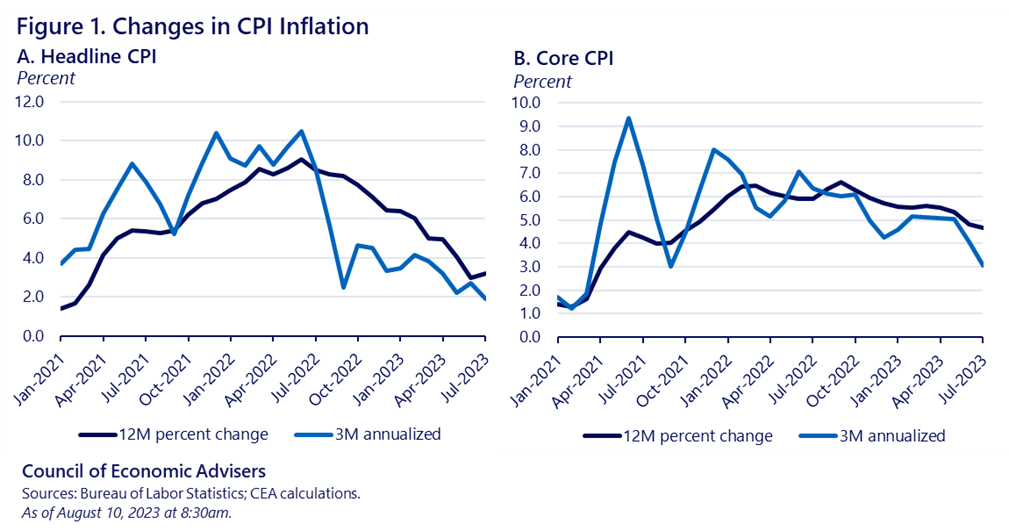
You will note that the 3-month annualized figure is considerably more jumpy (a technical term) than the 12-month changes. In fact, there is a trade-off between signal and noise invoked by such comparisons. Longer spans smooth out the noise and can boost the signal but often do so at the expense of evaluating more recent trends. This is clear in Figure 1-A above: from January 2021 to July 2022, yearly headline inflation was generally lower than the three-month rate, indicating that more recent inflation data was coming in hotter than earlier data. Since mid-2022, this pattern has flipped: the 3-month rate has been consistently below the year-on-year rate, suggesting that more recent inflation data have been cooler.
The question of which timespan to use is particularly germane in the July CPI data because of a so-called base effect in the yearly data. Base effects (whoops—my bad—that link is to a bass effect…totally different; that said, Paul Chambers was the man—if you don’t believe me, ask Miles or Coltrane; here’s the right link, and here’s another, more contemporary bass effect), occur when the base, or initial month, of a growth rate is unusually low or high.
In fact, this was the case last July, as shown in the figure below. We can think of the year-on-year inflation rate as roughly the sum of the current monthly inflation rate plus the previous 11 months’ rates.[2] Gasoline prices peaked in June 2022 and then began to fall. The resulting fall in energy prices contributed to a 0 percent (actually very slightly negative) monthly CPI reading in July of last year. That unusually-low 0 percent inflation number has been factored into every yearly inflation calculation since, through last month (June 2023). The fact that it is not factored into today’s rate is one reason for the pattern you see at the end of the first figure above, where the yearly rate ticks up but the 3-month rate falls.

Figure 3 shows annualized inflation (core and headline) rates at four different timespans (12, 6, 3, and 1 month) between this July and last July. To the extent that this year’s bars are lower than last year’s, we learn that inflation has trended downward. To the extent that a given year’s bars go up or down as the timespan shrinks, we learn whether inflation is speeding up or slowing down.

Especially for headline inflation, we see much lower inflation now compared to a year ago. Core inflation has slowed too, but not as quickly. Importantly, Figure 3-B shows the dynamic revealed in today’s report: lower growth rates at shorter spans, a sign of slowing core inflation.
Another trend worth highlighting from today’s report is the increase in real wages. Nominal wage growth has generally slowed in recent months, but not as much as inflation, such that the buying-power of hourly wages has been rising. Figure 4 plots the real hourly wage relative to a prepandemic trend line. The figure on the right shows that for middle- and lower-wage workers, real pay is back on its prepandemic trend.[3] The figure on the left shows real wage growth in recent months for all private-sector workers, though for this broader group they remain below trend. This pattern also suggests that real wages are growing faster for middle- and lower-wage workers. Since these workers’ bargaining power is more sensitive to labor market conditions than that of higher-wage workers, this is a familiar dynamic when the labor market is persistently tight.

While our work is not done in this area, Bidenomics is designed to preserve and build on these trends of slower inflation and faster real wage growth, and the CEA will continue to carefully track their evolution, doing our best to pull the signal from the noise.
[1] “Annualized” means that were inflation to continue to grow at this three-month rate for 12 months, this would be the 12-month, or yearly, growth rate.
[2] More precisely, the year-on-year rate is the geometric sum (the cumulative product) of the 12 individual monthly percent changes. One can also use changes in natural logs, which approximate percent changes, in which case the annual rate is the arithmetic sum of the last 12 monthly log changes.
[3] Classified as “production, non-supervisory,” these workers represent the 80 percent of payroll employees that are blue-collar in production jobs and non-managers in services.