
Disinflation Explanation: Supply, Demand, and their Interaction
This morning, we learned that core PCE inflation—which excludes volatile food and energy prices—was 0.2 percent in October on a monthly basis and 3.5 percent over the past year. That means that since core PCE inflation peaked at 5.6 percent in February 2022, it has fallen by 2.1 percentage points; headline PCE inflation is down 4.1 points from its peak. In contrast, while this disinflation has occurred, the unemployment has stayed historically low.
Table 1 shows how much yearly inflation, both PCE and CPI, has come down from peaks reached last year. From peak to October 2023, substantial disinflation is evident. At the same time, the unemployment rate has remained historically low: October was the 21st consecutive month with an unemployment rate below 4 percent, a run unseen in more than 50 years.
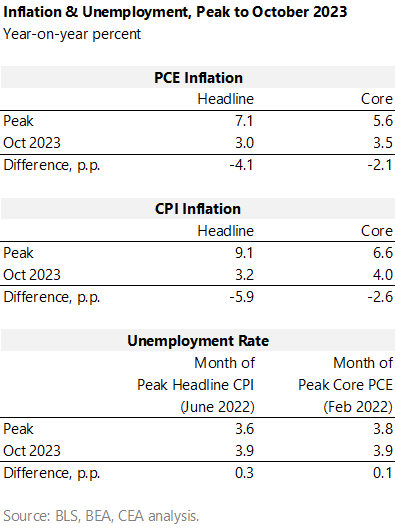
This much disinflation without a substantial rise in unemployment contradicts the conventional economic rule-of-thumb that it takes much more labor market slackening than we’ve seen to get inflation down this much.
While some have labeled this unusual pattern “immaculate disinflation,” CEA has argued that a likely explanation is straightforward: normalization of the economy’s supply side. The rise in inflation earlier in the pandemic was driven by two primary factors: pandemic-driven supply-chain bottlenecks and strong consumer demand, which includes compositional shifts in demand from goods to services.[1] Moreover, supply and demand do not occur in isolation; they interact with one another. Supply chain disruptions are more inflationary if they occur in the context of strong demand, where they are more likely to bind, than in a weak one where demand is slack.
The disinflationary story, at least so far, is largely an unwinding of these same dynamics. First, supply chains that were severely disrupted by the pandemic have, by some measures, mostly unsnarled. Second, again, by various measures, demand has cooled: the labor market for example, though still quite tight, is growing at a more sustainable pace than a year ago, while employment rates among prime-age (25-54) workers has reached levels not seen since 2001.
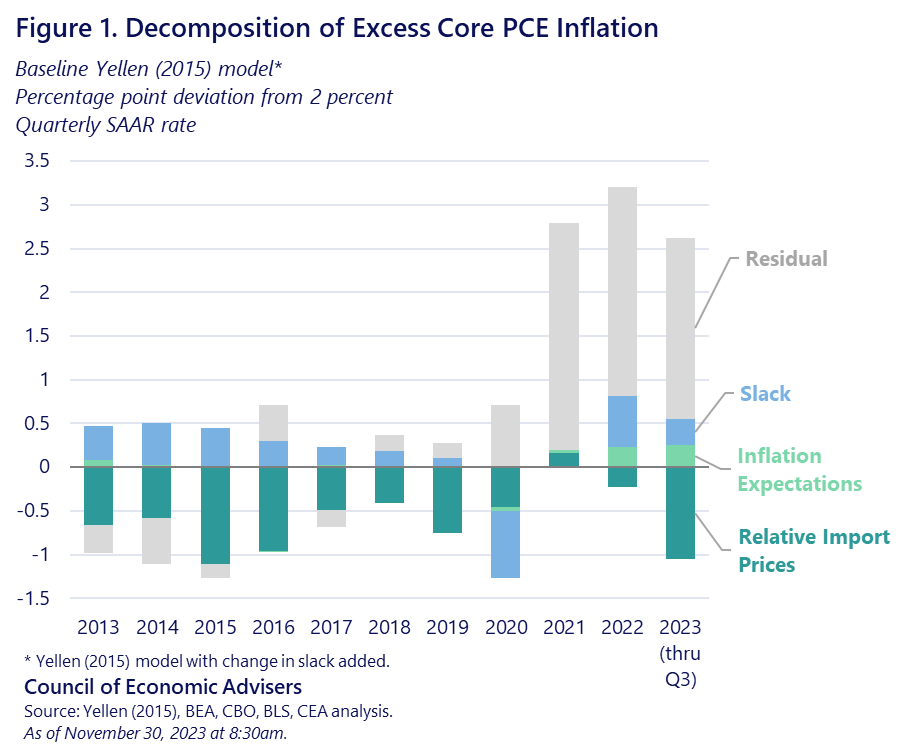
To quantify this inflation and disinflation narrative, we use a model of inflation introduced by then-Federal Reserve Chair Janet Yellen in 2015. The original model estimates excess core inflation as a function of lags of itself, inflation expectations, relative import prices, and labor market slack as measured by the Congressional Budget Office’s unemployment gap.[2] Figure 1 shows how much (in percentage-point terms) the model assigns to these various factors in terms of “excess” core inflation, i.e., how much each factor is responsible for pushing inflation above or below the Fed’s 2 percent target. For example, from 2013 to 2019, tight labor markets contributed around a third of a percentage point to excess core inflation. In the pandemic-induced recession of 2020, when the unemployment rate spiked to 14.7 percent, that factor turned negative, a good example of the more-slack-less-inflation rule of thumb.
However, this baseline model leaves most of the excess inflation of 2021, 2022, and 2023 unexplained (gray bars), suggesting that we must go beyond the variables enumerated in the model to explain the rise and fall of pandemic inflation.
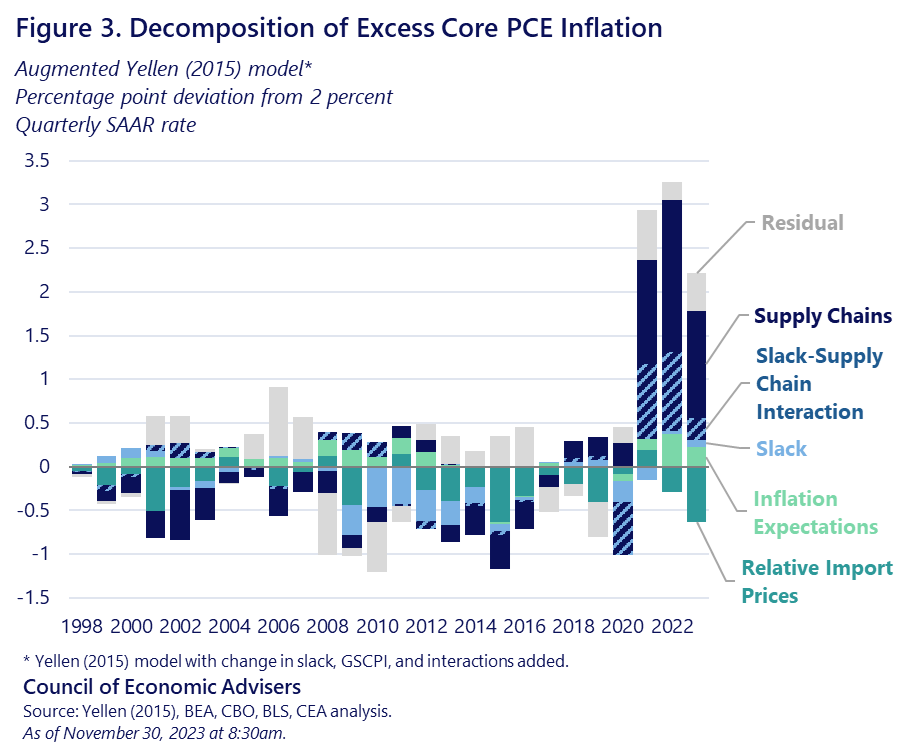
Adding a measure of supply chain bottlenecks to the model accounts for most of this residual. Figure 2 shows the results after including the Federal Reserve Bank of New York’s Global Supply Chain Pressures Index (GSCPI) to the Yellen (2015) model. Because strong demand occurring at a time of snarled supply chains can exacerbate inflation (relative to a period with more normal supply chains) the model includes a variable for supply-demand interactions: GSCPI enters into the model both on its own and interacted with labor market slack; the decomposition depicted in Figure 2 accounts for these interactions separately rather than attempting to allocate them between supply and demand.
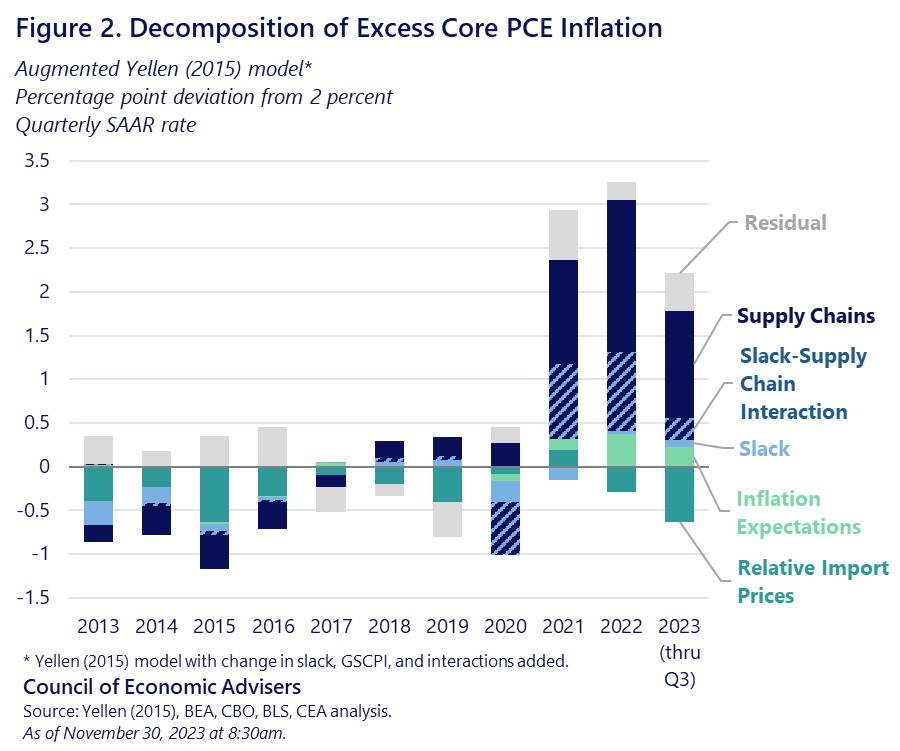
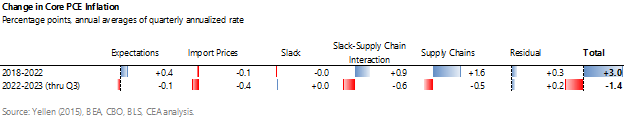
The augmented model (Figure 2) shows that supply chains, either alone or interacted with slack, explain most of the excess core inflation from 2021-23.[3] Likewise, supply chains in some form—either alone (purple bars in Figure 2) or in tandem with slack (red bars)—explain more than 80 percent of the disinflation the US has experienced since 2022 (Table2 below, second row). By contrast, because the unemployment rate has not changed much since 2022, the model assigns little effect to labor market slack on its own.[4]
The uniqueness of these past few years is evident in the next figure, which applies the augmented model back to the late 1990s. The figure illustrates the uniqueness of the pandemic experience; for example, in the early years of the Great Recession recovery, the primary disinflationary driver was slack alone. There was, of course, little excess inflation in those years as inflation mostly missed its target from the downside. But supply chains were not much of an inflationary factor at all in those years, and inflation analysts could ignore them with impunity. Clearly, that is not the case today.
Several caveats are worthy of consideration. First, while we have made significant progress in getting inflation back to pre-pandemic levels—annualized core PCE inflation over the past three months was 2.4 percent—it still remains above the Federal Reserve’s target of 2 percent for the PCE deflator. As President Biden consistently says, we have more work to do on behalf of American families. That said, the results of the model reveal that lower inflation has been achieved while maintaining tight labor markets. But it is possible that getting inflation back to target will require more economic cooling than we’ve seen thus far.
Second, as the model makes clear, supply-chain disruptions alone were not the only factor pushing up inflation. Strong demand, coupled with pandemic-induced compositional shifts away from services to goods, interacted with these snarled supply-chains, adding pressure to price growth over this period. It takes both supply and demand tell a complete story of the pandemic inflation experience. The good news is that inflation is reliably easing, while the labor market remains strong, helping to boost the purchasing power of workers’ rising paychecks.
Technical Appendix
The original Yellen (2015) model is a constrained OLS regression of the following form:
inflationt = b0*inflationt-1 + b1*inflationt-2 + b2*inflation expectationst + b3*RPIMt + b4*slackt + et
Where inflation is quarterly core PCE inflation at an annualize rate, inflation expectations are long-run PCE inflation expectations taken from the Philadelphia Fed’s Survey of Professional Forecasters, RPIM is import price inflation measured relative to core inflation, and slack is CBO’s unemployment rate gap. The coefficients on lagged inflation and inflation expectations are constrained to sum to 1.
CEA’s baseline version of this model slightly modifies it by adding the 4-quarter change in slack:
inflationt = b0*inflationt-1 + b1*inflationt-2 + b2*inflation expectationst + b3*RPIMt + b4*slackt + b5*(slackt – slackt-4) + et
Finally, CEA’s augmented version of the model adds the New York Fed’s GSCPI, the 4-quarter change in GSCPI, and interactions with each slack term:
inflationt = b0*inflationt-1 + b1*inflationt-2 + b2*inflation expectationst + b3*RPIMt + b4*slackt
+ b5*(slackt – slackt-4) + b6*gscpit + b7*(gscpit – gscpit-4) + b8*gscpit*slackt
+ b9*gscpit*(slackt – slackt-4) + b10*(gscpit – gscpit-4)*slackt + b11*(gscpit – gscpit-4)*(slackt – slackt-4) + et
[1] In further analysis, CEA found that most of the remaining residual for 2021-23 shown in Figure 2 is explained by certain prices, especially ones involving financial products like portfolio management, that are imputed rather than directly observed. Over short frequencies, these imputations have inconsistent relationships with the macroeconomy and so can confound attempts to estimate inflationary pressures. Over longer periods however, these imputations have mostly neutral effects on inflation. Market-based core PCE inflation is an official BEA release that excludes these imputed prices (though notably still includes owner’s equivalent rent). Using market-base core inflation in our augmented model yields a superior fit, but the effects of supply chains and slack are largely the same as shown in our Figure 2.
[2] Figure 2 shows that recent inflation dynamics are well-explained using CBO’s unemployment gap, the same measure used in the original Yellen (2015). CEA also evaluated the 4-quarter change in the ratio of vacancies-to-unemployment (V/U) as an alternative slack measure. Those results tell a broadly similar story to Figure 2 in that supply chains and interactions with slack explain most of the pandemic inflation, but when using V/U much more of the effect stems from the interaction than when using CBO’s measure. Also, more of the excess inflation in 2022 and 2023 is explained by slack alone when using V/U.
[3] There are other idiosyncratic but important factors that have played a role too, including the war in Ukraine and non-pandemic supply issues such as the avian flu outbreak.
[4] CEA makes one small modification to the original Yellen (2015) model for this blog post: we allow slack to enter into the model both in level terms (as in the original) and in four-quarter-change terms; in our second exercise, we interact GSCPI with both of these terms.