
A New Wage Measure for Core Non-Housing Services
Policymakers, economists, and forecasters often track “core” inflation (price growth excluding food and energy) because it tends be a better predictor of future overall inflation than overall inflation itself. It has also been useful to further break down core inflation into three components: core goods, housing services, and core non-housing services, or NHS.
Core goods inflation—think clothing, appliances, cars, and electronics—has been cooling over the last year as COVID-related global supply chain disruptions have eased. Housing inflation meanwhile reflects growth in both new and existing rents with a lag; market data on new rents suggests there have been declines in rental growth recently that many analysts expect to show up as lower inflation later this year.
The last category, NHS inflation, has garnered considerable interest of late. Because non-housing services are more labor intensive than the other categories, some surmise that the tight labor market may be playing a meaningful a role in this part of inflation.
Several prominent wage measures like average hourly earnings (AHE) in the Establishment Survey and the Employment Cost Index (ECI) have seen slowing nominal growth but positive inflation-adjusted growth in recent months. However, neither of these measures are ideal for probing the potential relationship between NHS inflation and the labor market. The AHE is sensitive to compositional effects: the skews in average wages that can arise from hiring and firing. Even measures that do control for compositional effects, like ECI, are broad-based and do not focus on the industries that are the most relevant for wages in the NHS portion of the economy.
This blog post presents a wage measure that CEA has constructed to be specific to NHS industries, called “NHS AHE,” which addresses both limitations. Methodological details are in the data appendix, but to summarize, NHS AHE is a weighted average of the hourly wage in 175 detailed nonfarm payroll sectors from the monthly Establishment Survey, weighted by each sector’s share of 2019 labor costs in final demand consumption of services excluding food, energy, and housing. Because the weights are based on NHS labor costs, the index better reflects the dynamics of wages serving as inputs into NHS production than commonly-cited wage measures like AHE and ECI. And because the weights are fixed to 2019 levels, the index is less sensitive to compositional shifts than unadjusted average measures like AHE.
Figure 1 below plots two NHS AHE wage series: one for those in production, non-supervisory (PNS) jobs in the private sector (about 80 percent of the workforce) for whom there is a longer time series, and the other for all private sector workers. Most notably in regard to current NHS inflation, the figure shows that NHS nominal wages have historically been somewhat cyclical. In the post-pandemic expansion in particular, they grew very quickly, reaching a 7 and 8 percent annual rate in early 2022 for all private sector and PNS workers, respectively. Since then, however, these series have both eased substantially and both were rising at a yearly rate of between 4.5–5 percent in December.
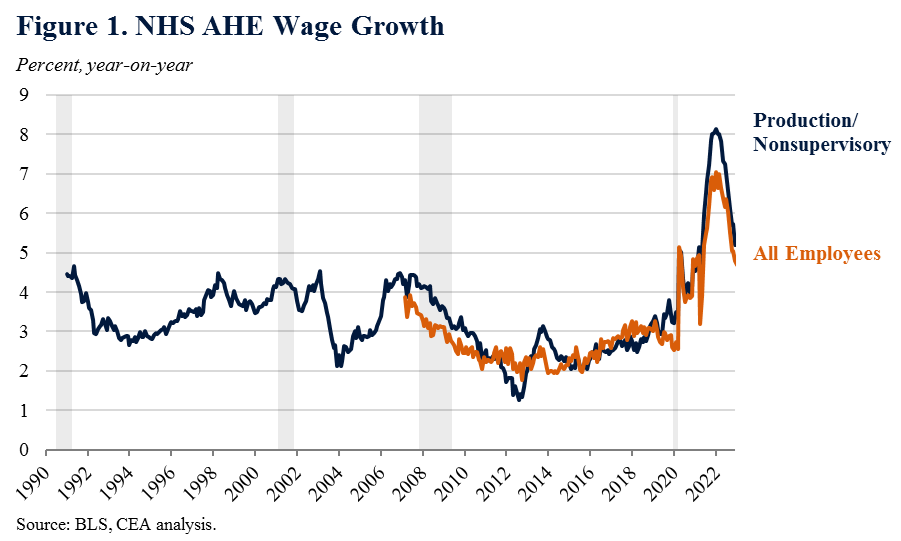
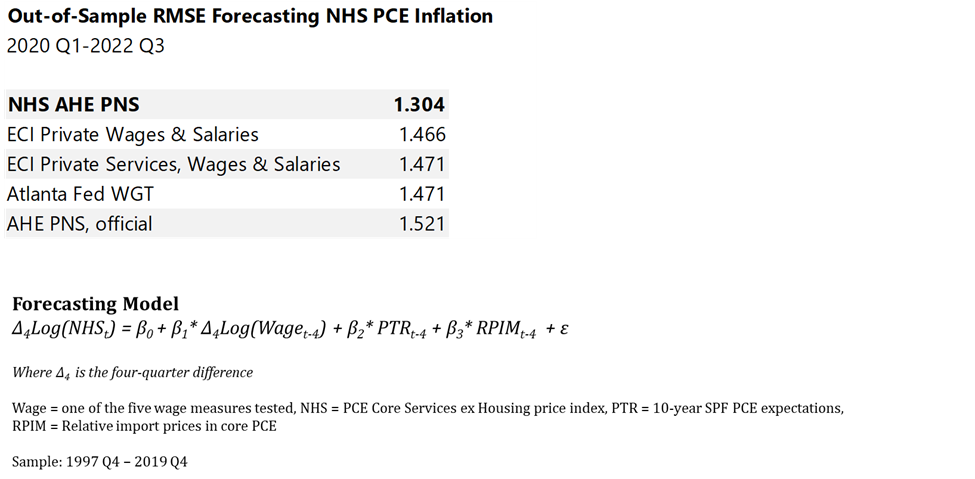
Figure 2 plots the yearly percent change in the NHS wage series for production and nonsupervisory workers and NHS inflation.[1] The two series are correlated, with a coefficient of 0.46 since 1991 and 0.83 since 2015. But both also reflect many disparate forces across the service economy and labor market. Therefore, to get a more rigorous sense of how well NHS AHE series can anticipate NHS inflation, one can compare its forecasting performance with other widely-used wage measures. A straightforward way to do this is 1) to calibrate a simple model of year-on-year NHS inflation using lagged inflation expectations, import prices, and wage growth over 1997-2019; 2) estimate different versions of this model using different wage measures; and, finally, 3) see how well each version performs out-of-sample during the pandemic beginning in 2020.
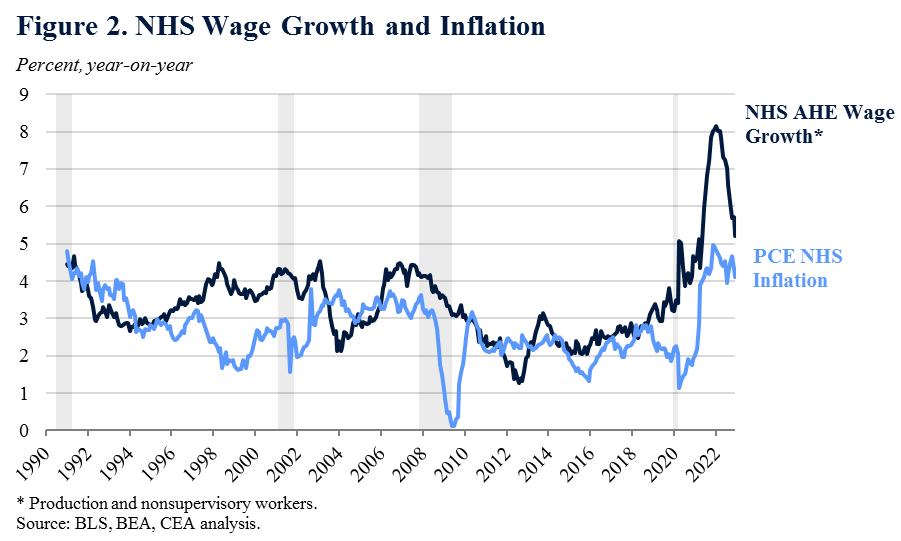
Table 1 below shows the average error (more precisely, the root mean squared error) of each model’s forecast during the pandemic. A lower number indicates more accuracy. As you can see, while none were spot on during the pandemic, the version using the NHS AHE measure outperformed measures like ECI, the Atlanta Fed’s Wage Growth Tracker, and the official version of AHE. This result suggests that NHS AHE improves economists’ ability to identify the drivers of NHS inflation.
Table 1
CEA will continue to track and report on these trends as they evolve.
[1] For reasons explained in the appendix, this blog post uses the PCE NHS series. The CPI version is biased down in recent months due to a technical adjustment in health insurance costs.
APPENDIX
Construction of the NHS AHE index
The NHS AHE index is an aggregate of detailed industry-level average hourly earnings released by the Bureau of Labor Statistics (BLS), weighted by 2019 labor costs in final demand consumption of services excluding food, energy, and housing.
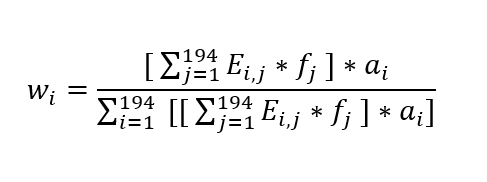
The underlying industry-level weights wi for each industry i are the product of three sources:
E The 2019 Employment Requirements matrix from BLS, a 194 × 194 industry matrix which gives the number of employees required in an industry i per $1 million nominal output in a given industry j. Not all 194 industries are included in NHS output, so we use N to denote the subset of j industries included in NHS.
f A vector of 2019 nominal output by 194 industries for personal consumption expenditures less food, energy, and housing. This is calculated by summing the relevant NHS final demand categories for each industry in the BLS Input-Output matrix. fi denotes the 2019 nominal output for industry i.
a A vector of 2019 average weekly wages by detailed private nonfarm payroll industry, from the BLS Establishment Survey. ai denotes the 2019 average weekly ages for industry i. The Establishment Survey only covers private nonfarm industries, therefore ai only contains information for 175 detailed industries; the others are given a value of 0. Different versions of ai are used for the All Employee and Production/Nonsupervisory versions of the NHS AHE index.
For each industry-level weight in industry i, the number employees provided by industry i per $1 million in nominal output in industry j is multiplied by the 2019 nominal NHS output in industry j. This gives the total number of employees required in industry i to produce NHS output. Next, this sum is multiplied by the average weekly wages in 2019 in industry i to calculate aggregate weekly 2019 payrolls costs in industry i for NHS output. Finally, to convert this into a share, this value is divided by the total weekly payrolls across all industries for the payrolls in industry i as a share of total payrolls for NHS output.
(1)
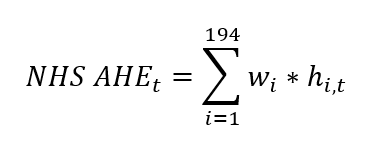
The final NHS AHE index is the sum of the product of the fixed weights w and monthly average hourly earnings for industry i in month t:[2]
(2)
A note on NHS inflation in CPI and PCE
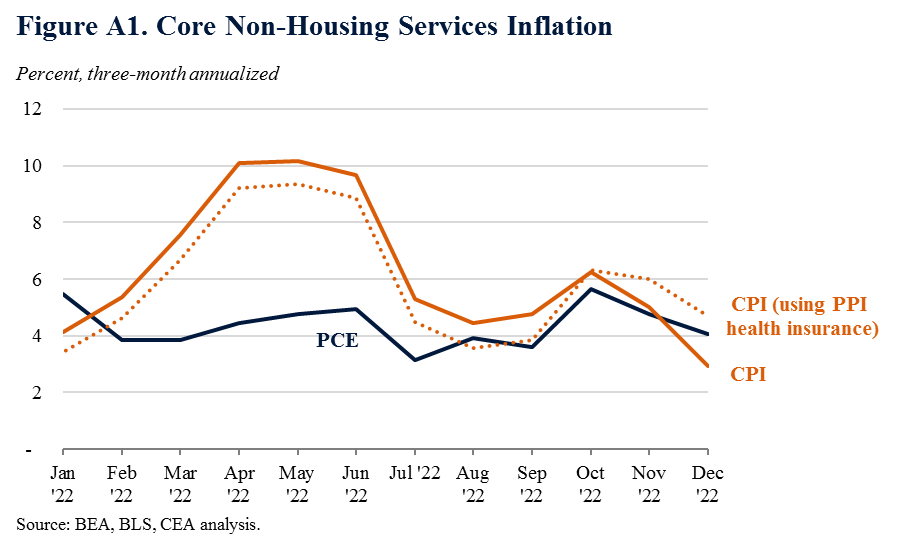
The Consumer Price Index (CPI) and the price index for Personal Consumption Expenditures (PCE) are both measures of prices faced by consumers. While the two share many underlying data sources and concepts, they differ in important ways, including their methodologies, formulas, weights, and scopes. When measuring NHS inflation in particular, CPI has shown greater declines in recent months than its PCE counterpart. Half of the decline in three-month NHS CPI inflation since October is due to the sui generis way CPI measures health insurance prices. If NHS CPI used the Producer Price Index (PPI) for health insurances—the same index used in PCE—then NHS CPI inflation still would have declined but at a much more modest rate, closer to the declines seen in PCE (see Figure A1).
[2] BLS releases detailed industry wage data on a one-month lag from major industry data. Therefore, for the latest Establishment Survey month, CEA calculates a preliminary increase in NHS AHE that uses the same methodology, but with employment, output, and weekly wage data aggregated by major industry. This preliminary calculation is then updated the following month when BLS releases detailed-industry wage data.