
What to Expect: The 2022 Census Poverty, Income, and Health Insurance Reports
Ahead of the Census Bureau’s release of the 2022 income, poverty, and health insurance report, the CEA outlines its expectations and important contextual information to help inform our understanding of the data.
This Tuesday, the Census Bureau will release its annual reports on poverty, income, and health insurance, covering outcomes for calendar year 2022. These reports will provide a detailed look at the economic well-being of the country 9 to 20 months ago. In this blog, the CEA lays out its expectations for these reports and puts the 2022 experience in recent context.
The CEA expects the Census data to likely show a rise in poverty and decline in real (inflation-adjusted) incomes in 2022, while also likely showing an improvement in the uninsured rate. Higher frequency data released since 2022 strongly suggest that some of the 2022 income dynamics that Census is expected to report on Tuesday have improved substantially in 2023, as employment and labor supply have continued to reach new highs, inflation has fallen substantially, and real earnings have grown. On the other hand, the increase in poverty is likely to persist absent congressional action to restore the enhanced Child Tax Credit (CTC), as President Biden has proposed.
Poverty
Though these data have yet to be released, the CEA expects the Census report to show a sharp rise in the Supplemental Poverty Measure (SPM) in 2022.[1] To understand why this is likely to happen in 2022, it is crucial to remember what happened in 2021.
When President Biden came into the White House, the economic recovery from the pandemic was still deeply uncertain. The U.S. had lost more than 250,000 jobs the month before President Biden took office, and just after his inauguration the independent Congressional Budget Office projected it would take until the end of 2025 for the unemployment rate to fall back below 4 percent.
Faced with this, President Biden signed the American Rescue Plan (ARP) in March 2021. The goal of the ARP was to provide robust public health and economic support through a variety of initiatives, including COVID-19 vaccine distribution and augmented unemployment insurance for the jobless. In part because of this historic response, the subsequent economic recovery was stronger than had been expected beforehand: for example, the unemployment rate fell below 4 percent at the end of 2021, four years earlier than originally projected.
Two ARP policies in particular substantially reduced poverty in 2021: the significant increase in the CTC, which included making the full credit available to the lowest-income children for the first time, and the Economic Impact Payments (EIPs) sent out in March 2021.
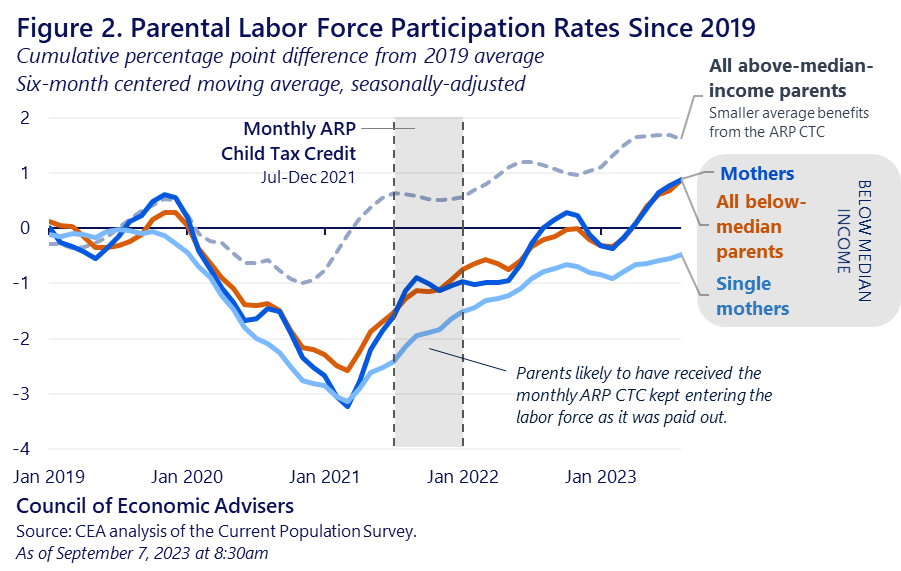
These provisions had a dramatic effect on poverty in 2021, in particular child poverty, as Figure 1 illustrates. Taken together, the CEA finds that the EIPs and the CTC shaved almost 10 points off of the child poverty rate in 2021, reducing it by two-thirds. The enhanced CTC alone lifted almost 3 million children out of poverty in 2021 and cut the child poverty rate by more than 40 percent in 2021. Other data suggest that the enhanced CTC also contributed to improved financial security for parents more broadly. And there is no evidence that these gains came at the expense of employment: lower-income parents—who were eligible for larger ARP CTC benefits on average—continued their strong labor force participation gains in the second half of 2021 as they received the monthly credit (see Figure 2).
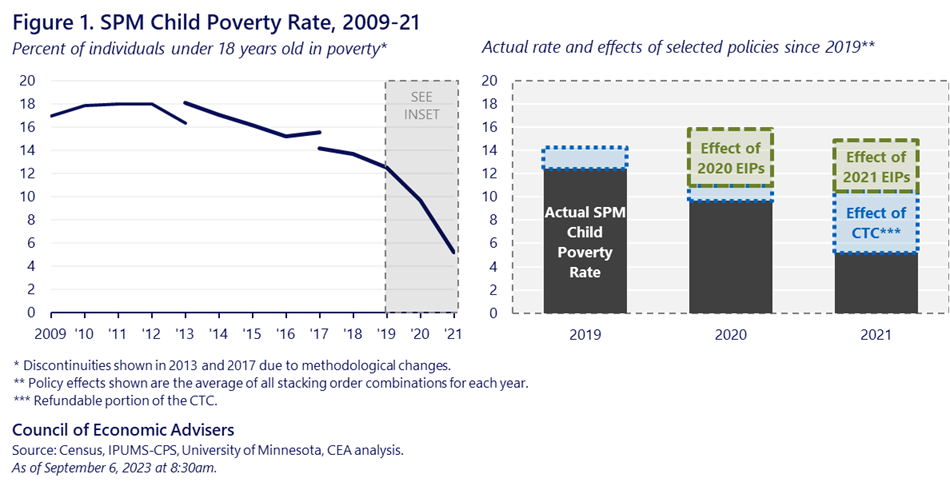
However, Congress did not extend the ARP’s expanded CTC when it expired at the end of 2021. As a result, in 2022, it reverted back to its 2019 scope, in particular excluding many low-income families. This, combined with the expiration of the EIPs and other pandemic aid received in 2021, means that SPM poverty in 2022 is very likely to be significantly higher than in 2021. As an illustrative exercise: without the EIPs, and assuming the CTC was limited to its 2019 scope, child poverty in 2021 would have been two and a half times higher.
Some policies in place in 2022 likely helped mitigate the rise in child poverty, including the Department of Agriculture’s reevaluation of the Thrifty Food Plan in 2021, which determines SNAP benefit amounts and lifted about 1 million children out of poverty. But these actions will not compensate for the expiration of the enhanced CTC. President Biden has consistently called on Congress to restore the more generous CTC to preserve our progress towards ending child poverty, progress that, if sustained, a growing body of evidence suggests would have long-run benefits to children.
Income
The CEA expects Census measures of nominal income to rise in 2022 and real (inflation-adjusted) income to fall. In 2020, both nominal and real household income fell, by 1 percent and 2.3 percent respectively. This story partially reversed itself in 2021, when nominal household income grew by 4.1 percent. However, elevated pandemic inflation meant real income growth remained negative in 2021. The CEA expects a similar story in 2022, a year with strong nominal wage gains but also inflation that had only begun to fall in the middle of the year thanks both to persistent pandemic factors as well as new factors such as the Russian invasion of Ukraine and avian bird flu.
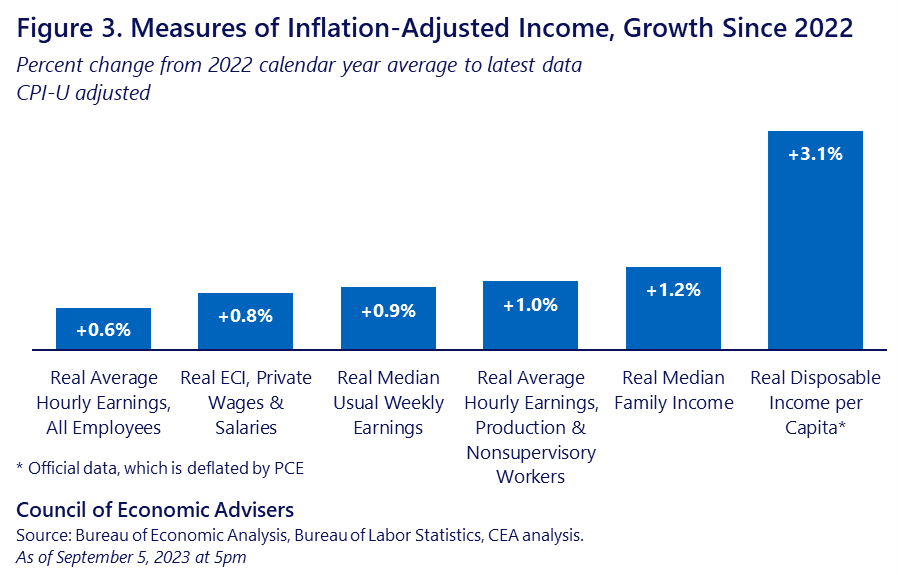
Recent data not reflected in next week’s Census report tell a more optimistic story since 2022: various real wage and income measures have turned positive in recent months, as shown in Figure 3. This result has come about because nominal income growth either remained steady or cooled off modestly, while inflation saw a robust decline: annual CPI inflation peaked in June 2022 and has fallen by two-thirds since then. For example, real average hourly earnings for all workers are up 0.6percent from their 2022 average; for the 80 percent of employees who are production and nonsupervisory workers, wages are up 1.0 percent. The CEA’s estimate of monthly real median family income using the Current Population Survey—the concept closest to what Census reports—is up 1.2 percent. As a result, real wage measures are higher now than they were before the pandemic, with particularly large gains for low and middle earners—despite the pandemic downturn in 2020 and elevated pandemic inflation in 2021 and 2022.
Health Insurance
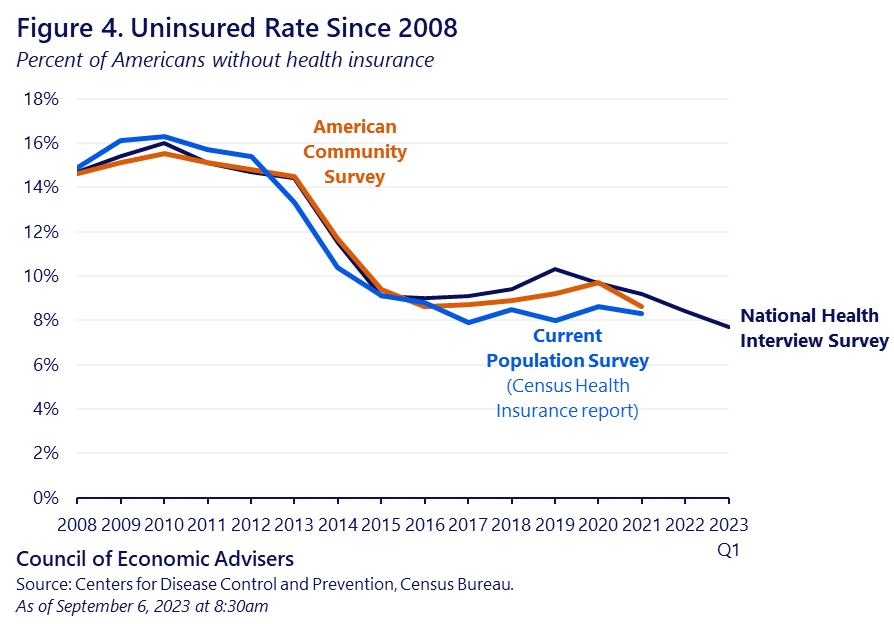
In 2021, Census reported that the share of Americans without health insurance fell to 8.3 percent, near a record low. Based on higher frequency data from the Centers for Disease Control and Prevention’s National Health Insurance Survey (NHIS), which can broadly anticipate the annual Census data, the CEA expects Census to show the uninsured rate falling again in 2022, though as with all surveys there is some uncertainty. The NHIS uninsured rate reached a record annual low in 2022 and continued falling in 2023 Q1, reaching an all-time low of 7.7 percent (see Figure 4). Historic progress in reducing the uninsured rate reflects the strong economic recovery since 2021 and policy choices, including more generous financial assistance for people purchasing Affordable Care Act health insurance thanks to the ARP and then continued through 2025 in the Inflation Reduction Act, recent state Medicaid expansions, and Administration policies that have made it easier for people to enroll in health coverage.
The CEA will provide a full rundown of the Census results shortly after their release.
[1] The CEA focuses here on the SPM instead of the Official Poverty Measure (OPM) as the SPM a) has updated thresholds that better reflect today’s consumption patterns, and b) includes more sources of income and expenses than the OPM, thereby providing a more accurate poverty rate.