
The 2022 Income, Poverty, and Health Insurance Reports
This morning the U.S. Census Bureau released its annual reports on poverty, income, and health insurance for 2022. Here are the topline findings:
- The Official Poverty Measure (OPM) was essentially unchanged last year, at 11.5 percent. But due in large part to the expiration of key anti-poverty measures, the Supplemental Poverty Measure (SPM),[1] which accounts for more government benefits, taxes, and expenses than the OPM, rose from 7.8 percent in 2021 to 12.4 percent this year.
- The SPM rate for children more than doubled, from 5.2 to 12.4 percent. A significant piece of this rise was the 2021 expiration of highly potent, targeted tax benefits, including the expanded Child Tax Credit (CTC). Over five million children were added to the 2022 poverty rolls by this metric, by far the largest increase in SPM poverty on record.
- Real median household income fell 2.3 percent last year. In more recent months, however, the persistence of the strong labor market and the decline in the rate of inflation have to led to rising real wages and incomes.
- The share of Americans without health insurance dropped to 7.9 percent in 2022, down from 8.3 in 2021 and 8.6 percent in 2020.
Key Observations from the Census Report
The data in today’s report, along with more recent data from other sources, underscore the importance of public policy that supports economically-vulnerable families. This is clear from the sharp uptick in SPM poverty, especially for children, a function of the expiration of the expanded CTC and other tax benefits. Further, the increase in the share of Americans with health insurance coverage reflects the strong economic recovery since 2021 and policy support for health insurance coverage.
The data also reveal the role of high inflation in 2022 and the importance of more recent developments wherein the job market has remained strong while inflation has subsided. Real median income fell in 2022, but nominal income growth was strong that year, up 5.4 percent, driven in part by rising labor force participation, which is shown in the report as an increase in the share of Americans working full-time for the full year. But the inflation measure used in this report rose 7.8 percent last year, leading to the real decline.[2]
As the CEA stressed in a blog from last week in advance of this report, inflation has come down sharply since the period covered in this report, while the labor market has continued to deliver strong earnings opportunities for workers. We present these updated findings below.
SPM Poverty Driven Up Sharply Due to the Loss of the CTC
The more-than-doubling of child poverty in 2022 is to a significant extent a result of the loss of historically powerful anti-poverty policies, including the expanded CTC, a policy President Biden has consistently fought to reinstate. An important slide from today’s presentation by the Census Bureau underscores this point. The figure shows pre- and post-tax poverty rates using the supplemental poverty measure. Since the U.S. has delivered several important anti-poverty programs through the tax code for some time now, post-tax poverty is normally slightly below pretax poverty. But the expansion of the CTC and other pandemic-era tax benefits, such as the Economic Impact Payments (EIPs), caused the gap between the two lines to grow historically large in 2021, implying much stronger anti-poverty impacts from measures introduced that year.
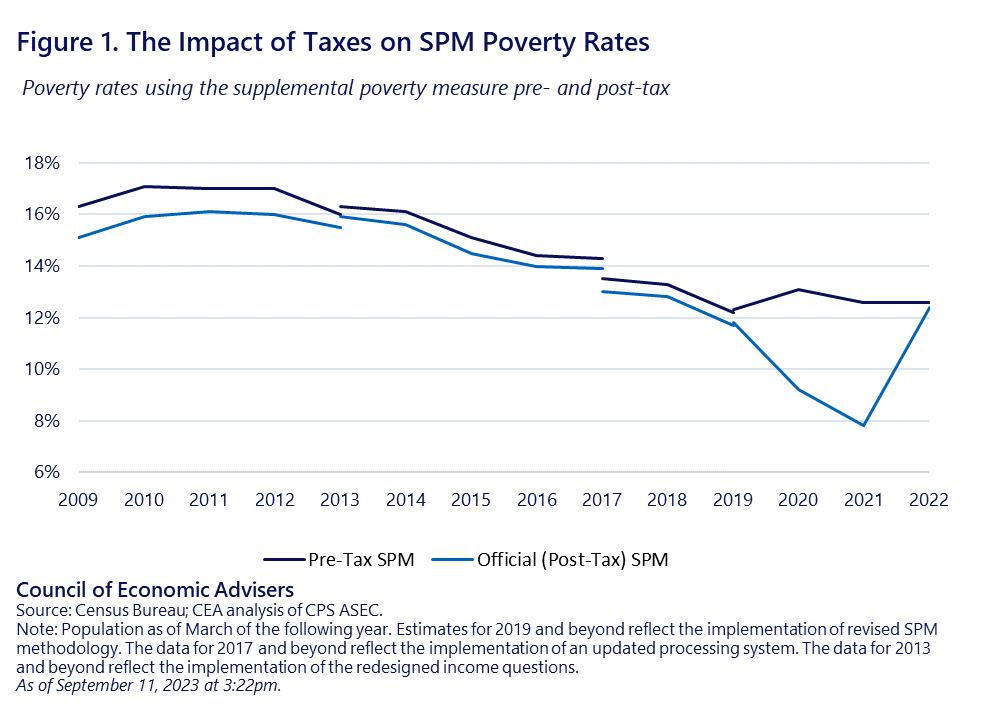
The increase in child poverty resulting from the loss of these tax supports was even greater than the overall increase. After falling from 12.6 percent in 2019 to 5.2 percent in 2021, SPM child poverty more than doubled last year to 12.4, slightly below its 2019 level. As the CEA reported last week, the EIPs and the CTC shaved almost 10 points off of the child poverty rate in 2021, reducing it by two-thirds. The enhanced CTC alone lifted almost 3 million children out of poverty in 2021 and cut the child poverty rate by more than 40 percent in 2021. The more-than-doubling of child poverty we saw in this report was the tragic but predictable consequence of failing to extend that support.
Though the Census Bureau’s time series for the SPM only goes back to 2009, academic researchers at Columbia University have made similar estimates back to 1967. Never before have we seen such a sharp increase in SPM poverty as occurred last year. As the figure above makes unequivocally clear, this was not a market-driven development. It was a policy decision, one President Biden will continue striving to reverse.
Real Incomes Down in 2022, But Up This Year
Median household income, pre-tax and adjusted for inflation, fell 2.3 percent last year. As noted, this was the outcome of fast nominal growth but even faster inflation. These strong nominal gains partly reflected increased employment, hours, and wages in 2022 (which has continued into this year). While the number of total workers in the Census data increased by 1.7 percent last year, the number of full-time, full-year workers increased by 3.4 percent, a sign of labor market participants shifting from part-time or part-year work to full-time. In fact, the 65.6 percent of women who worked full time, full year last year represent the largest such share on record, with data back to 1967.
Looking at the race and Hispanic origin of the householder, the decline in real median income was driven by white, non-Hispanic households, while other household’s real incomes held steady. This may relate to the fact that tight labor markets disproportionately help lower-income and minority households whose employment and earnings tend to be more elastic to low unemployment than higher-income households.
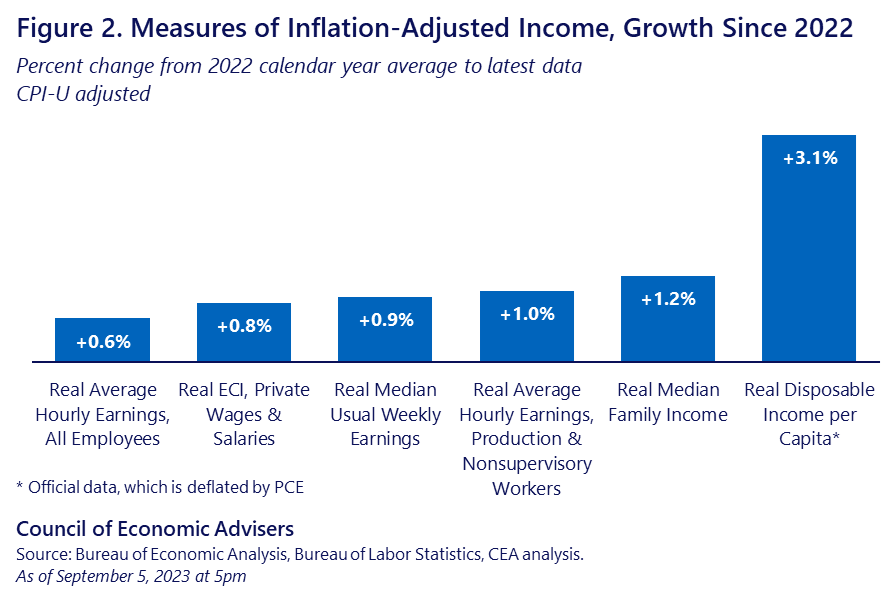
This important dynamic, wherein persistently tight labor markets disproportionately help middle and lower-wage workers, has continued into 2023 (unemployment averaged 3.6 percent last year and has held that average so far this year as well), while at the same time inflationary pressures have eased. The annual growth rate of the Consumer Price Index peaked in June of last year and has dropped by about two-thirds since then. As the figure below shows, real average hourly earnings for all workers are up 0.6 percent from their 2022 average; for the 80 percent of employees who are production and nonsupervisory workers, wages are up 1.0 percent. The CEA’s estimate of monthly real median family income using the Current Population Survey—the concept closest to what Census reports—is up 1.2 percent. As a result, real wage measures are higher now than they were before the pandemic, with particularly large gains for low and middle earners—despite the pandemic downturn in 2020 and elevated pandemic inflation in 2021 and 2022.
Health Insurance Coverage Rose in 2022
The uninsured rate (the share of persons with no health insurance coverage over the full year) fell last year by 0.4 percentage points, to 7.9 percent, matching the 2017 historic low. Here again, policy has made a difference, with the decline last year likely reflecting greater affordability of Affordable Care Act (ACA) health insurance coverage due to the American Rescue Plan’s enhanced premium subsidies, as well as various Medicaid expansions and outreach that occurred in recent years.
Because Census has altered the process by which it measures insurance coverage, it is difficult to make consistently measured longer-term comparisons. However, it is clear that the ACA has made a lasting difference in terms of coverage. The older measurement system showed that the uninsured rate fell from 13.3 percent before the ACA was enacted in 2013 to 8.8 percent in 2017, before Census shifted to the current measurement method. The Biden-Harris Administration is committed to building on this progress by continuing to advocate for policies like those that helped nudge the uninsured rate down last year.
Census also provides information about the source of insurance coverage. For example, the share of the population with government health insurance (for some or all of the year in each case) increased by 0.4 percentage points last year, from 35.7 percent to 36.1 percent, while the share with private health insurance decreased by 0.3 percentage point from 65.9 percent to 65.6 percent. The share with employment-based health insurance ticked up from 54.4 in 2021 to 54.5 percent in 2022.
Conclusion
Today’s data tell an important story about consequential impacts of public policy for low-income Americans’ living standards. The Biden-Harris Administration has shown that, with targeted tax policies, we can substantially lower the rate of poverty, in general, and child poverty, in particular. Today’s release unequivocally shows the flip side of that insight: allowing these policies to lapse sharply raises poverty. In contrast, health-insurance policies have built on prior progress to further lower the share of Americans who lack such coverage.
Economic conditions also underly these results. While high inflation contributed to the decline in real median household income in 2022, our pursuit of tight labor markets and lower price pressures have helped to deliver rising real incomes and wages since 2022. It has also helped to pull more people into the labor market, as highlighted in today’s report.
The simple message of this report underscores the importance of inclusive tax and health care policies in tandem with tight labor markets and a strong overall economy.
[1] The SPM a) has updated thresholds that better reflect today’s consumption patterns, and b) includes more sources of income and expenses than the official measure.
[2] Census deflates nominal values in this report using the C-CPI-U index, a chain-weighted version of the CPI.