
Crosswalk Talk: What’s the difference between the PCE and the CPI?
Inflation as measured by the Personal Consumption Expenditures (PCE) price index rose 0.4 percent in August and 3.5 percent over the past year, according to data out this morning from the Bureau of Economic Analysis. Core PCE inflation, which leaves out food and gas prices, rose 0.1 percent monthly and 3.9 percent year-over-year.
The CEA discussed the highlights of the report in our X thread, as usual, making the following points:
- Over the last three months—which the CEA likes to look at as one way to reduce the noise of monthly data while also keeping the signal relatively recent—headline PCE has come in at a 3.1 percent annualized rate. This rose from last month primarily because of energy prices.
- In contrast, the three-month core inflation rate fell to 2.2 percent annualized in August, the lowest core rate since December 2020.
- Year-on-year, headline PCE ticked up to 3.5 percent while core PCE fell to 3.9 percent.
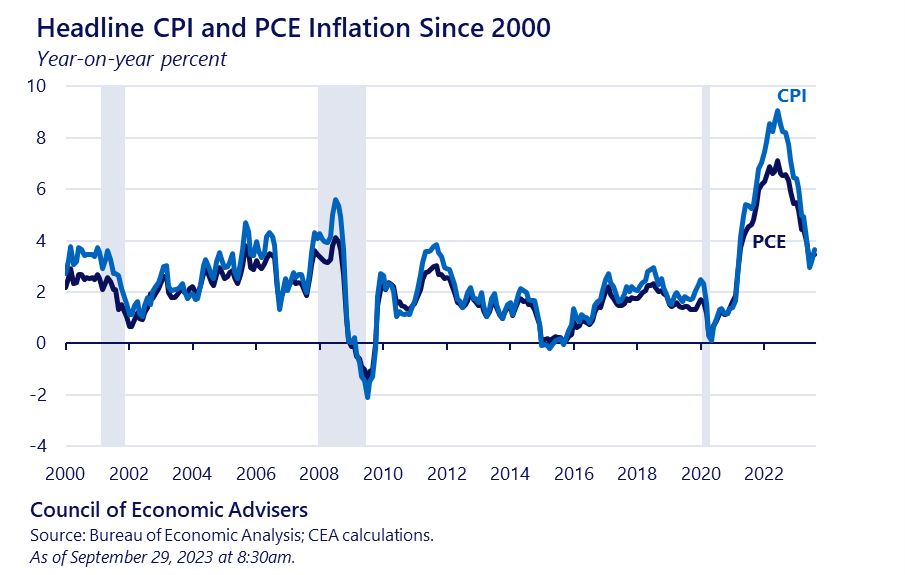
Inflation analysts generally track two separate measures of inflation: the Consumer Price Index (CPI) and the PCE. The two measures often move together, and in fact many of the underlying price indices that make up the PCE come directly from the CPI. Nevertheless, the two often show different inflation results over the same time period (see figure below). For example, in July, headline CPI and PCE inflation were close, each roughly 0.2 percent, and therefore a difference of nearly zero. But in August, the headline CPI was 0.6 percent while the PCE came in, as noted, at 0.4 percent; in other words, the difference grew by 0.2 percentage point. In fact, since 2000, annual PCE inflation has been around 0.4 percentage point lower than CPI inflation on average. In the rest of this post, we will explore why these differences arise.
There are four main reasons for this difference:
- Formulas: the growth in the two indices from one time period (month, quarter, year) are computed using substantively different formulas;
- Weights: they apply different weights to their consumption categories;
- Scope: they measure the prices of somewhat different consumer items and who purchases them;
- Other reasons: A grab bag of other differences, including different price data for what is conceptually the same product. For example, both CPI and PCE measure the price of airfare, but CPI calculates it using a fixed basket of air routes, while PCE calculates it using data on airline passenger revenues and passenger miles traveled. Also, the two incorporate different patterns of seasonal adjustment.
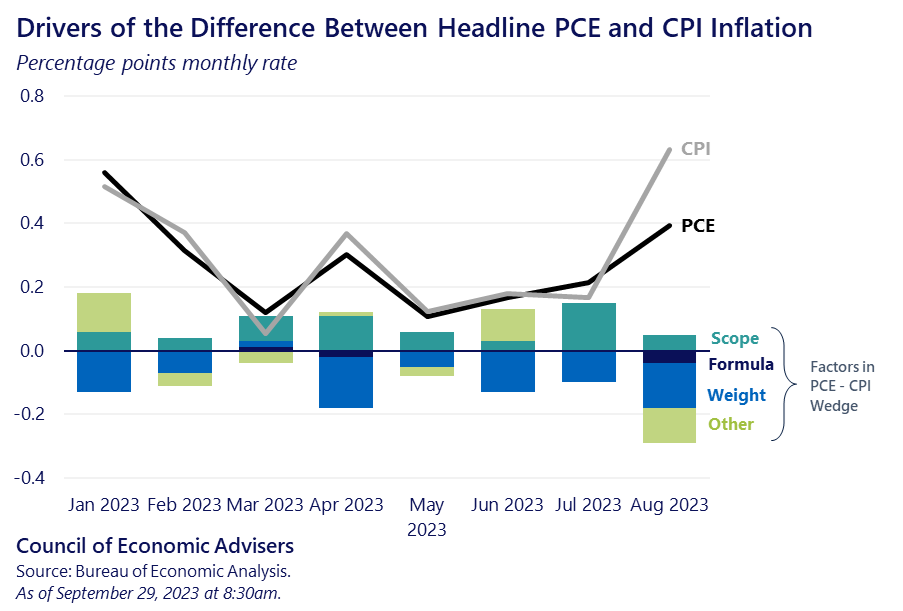
The figure above decomposes recent monthly PCE and CPI inflation reads between these four factors. While we will reluctantly resist the pull into weedy details, we will note a few consistent impacts of these differences. Because the PCE formula allows for consumers to substitute each month between items based on their relative prices—for example, switching from beef to chicken if the beef price spikes up—it tends to grow more slowly, though the effect is relatively small in the figure above.
PCE also weights items differently than CPI and the figure shows this difference to be more consequential, with PCE weights leading to lower measured inflation so far this year. This implies that the PCE gives less weight to prices that have been growing more quickly in the CPI over this period. Housing is an evergreen example of this difference: housing makes up 33 percent of the CPI basket but only 15 percent of PCE. In August specifically, the lower weight of gasoline prices in PCE explained about 0.1 percentage point—nearly half—of the growth in the PCE-CPI wedge between July and August.
The two measures have different scopes as well—for example, PCE includes the price of all medical goods and services purchased by employer-provided insurance as well as public programs such as Medicare. CPI, in contrast, only includes medical items purchased out-of-pocket by households. The CPI also focuses exclusively on the (urban) household sector while the PCE’s scope pulls in prices from all areas and includes nonprofit institutions.
Finally, the two sometimes take different approaches to measure the same item. The airfare difference mentioned above explained another 0.1 percentage point of the July-August wedge growth.
Given economists’ congenital on-the-one-hand-on-the-other proclivities, do not bother asking us which measure is best (at the CEA, we equally love all of our children!). They each have their attributes and, as the first figure shows, closely track each other (and, in fact, share most of their source data). Most price analysts generally favor the flexible substitution characteristic of the PCE formula, while the scope and weighting factors in the CPI tend to hew more closely to consumers’ actual out-of-pocket spending, which is one reason why it is most often used to calculate inflation-adjusted wages. Therefore, we will continue to carefully track both indices.