An Update on Non-Housing Services Inflation: Progress in Wage-Sensitive Prices
Among the various indicators we track at the CEA is core non-housing-services (NHS) inflation. Because of its contribution to price pressures, this category, which leaves out energy, food, all goods, and housing, has been elevated in inflation analysis and the CEA has tracked both its progress and its relationship to wage growth. In this update, we find that the wage-sensitive part of NHS inflation has been easing, following a lag structure with NHS wages that we recently highlighted. The non-wage sensitive part has been noisy and difficult to interpret.
Because housing remains a significant, though easing, contributor to inflation, we also provide an update on that category.
NHS Inflation and Wage Growth
Thanks primarily to the substantial fall in inflation since last June and the persistently strong U.S. labor market, nominal wage growth has exceeded price growth in recent months. as the inflation-adjusted 12-month wage growth has flipped from positive to negative.
This is good news for American workers and consumers but it also raises the question as to whether wage growth has been adding to inflationary pressure. This question has been even more relevant in the last year, as goods and housing inflation have cooled, such that NHS inflation, which tends to be more labor-intensive than other sectors of the economy, has become a larger share of remaining excess inflation.
Back in February, the CEA published a blog post introducing a new wage index for non-housing services output designed to help analyze these questions. The CEA showed that NHS wages had accelerated to record growth by early 2022, but then had cooled substantially since then. A follow-up blog post in May estimated this effect more directly: the CEA found that the components of core non-housing services that were the most wage-sensitive made up roughly half of non-housing services consumption but explained all of the excess non-housing services personal consumption expenditure (PCE) inflation by early 2023. The CEA also found that non-housing services inflation lagged growth in our non-housing services wage index by around 10 months.
These two analyses suggested that wages could play an important role in services prices, but by early 2023 there were already suggestive signs that their contribution was diminishing and was likely to continue falling.
This blog post gives an update to both pieces of analysis, and shows that the last several months have played out largely as the CEA anticipated. Wage growth in non-housing services output has continued to cool and is nearly back to where it was just prior to the pandemic. Meanwhile, the wage-sensitive components of NHS inflation have also declined substantially; recent reads are nearly back to levels consistent with 2 percent overall core inflation. But wage-insensitive NHS inflation remains elevated, volatile, and difficult to interpret.
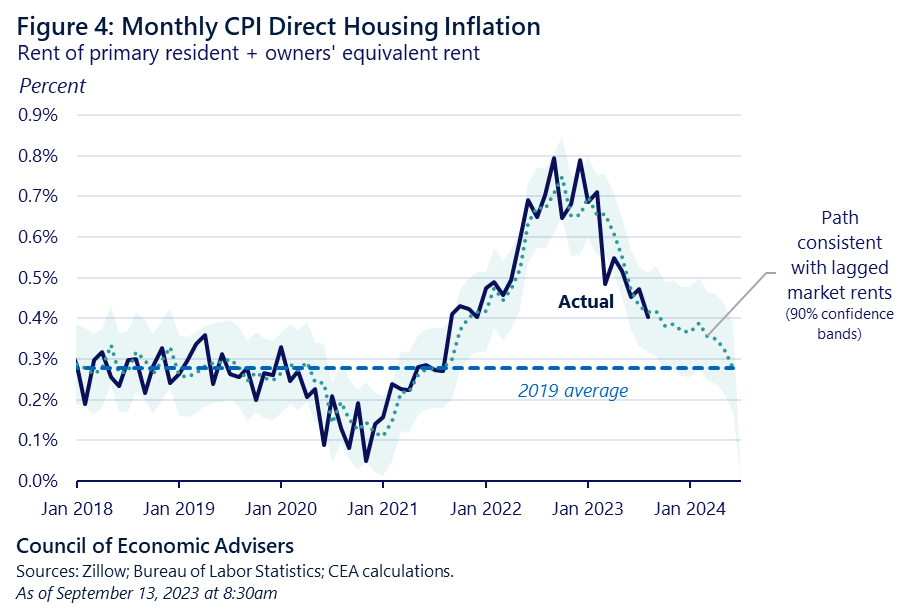
- Growth in our NHS wage index has slowed considerably. In August, NHS wage growth was 4.1 percent year-on-year, half of what it was at the beginning of 2022 (see Figure 1). That also means that NHS wage growth is getting close to where it was on the eve of the pandemic on a year-on-year basis: our index grew by 3.5 percent in February 2020. This suggests that whatever role labor costs have played in pandemic services inflation, their effect has been diminishing.
- Likewise, wage-sensitive NHS inflation has fallen as well, but not by as much as NHS wage growth—consistent with historical lags between NHS wages and NHS inflation. Price growth for the wage-sensitive components of non-housing services in PCE fell from a peak of 7.7 percent last October to 5.5 percent in August.This is still elevated, however: wage-sensitive NHS PCE inflation was around 2 percent just before the pandemic.
On a higher-frequency basis however, the progress has been much larger: three-month wage-sensitive NHS PCE inflation was 2.3 percent annualized in August, the lowest since June 2020.
Given the 10-month lag between NHS wage growth and wage-sensitive NHS inflation that the CEA found in our May blog post, it is not surprising that annual NHS inflation does not yet reflect the full extent of the cooldown in NHS wage growth.
- Wage-insensitive NHS PCE inflation has been noisy and difficult to interpret. Year-on-year wage-insensitive NHS PCE inflation was 3.1 percent in August. But it is higher, and has risen, on a three-month annualized basis, going from 0.5 percent as recently as May to 3.9 percent in August.
Wage-insensitive NHS includes several financial services prices that are imputed from market data like stock returns rather than directly observed. For example, prices for portfolio management services as measured in PCE rose by 6.9 percent between June and July, after being essentially flat between May and June.
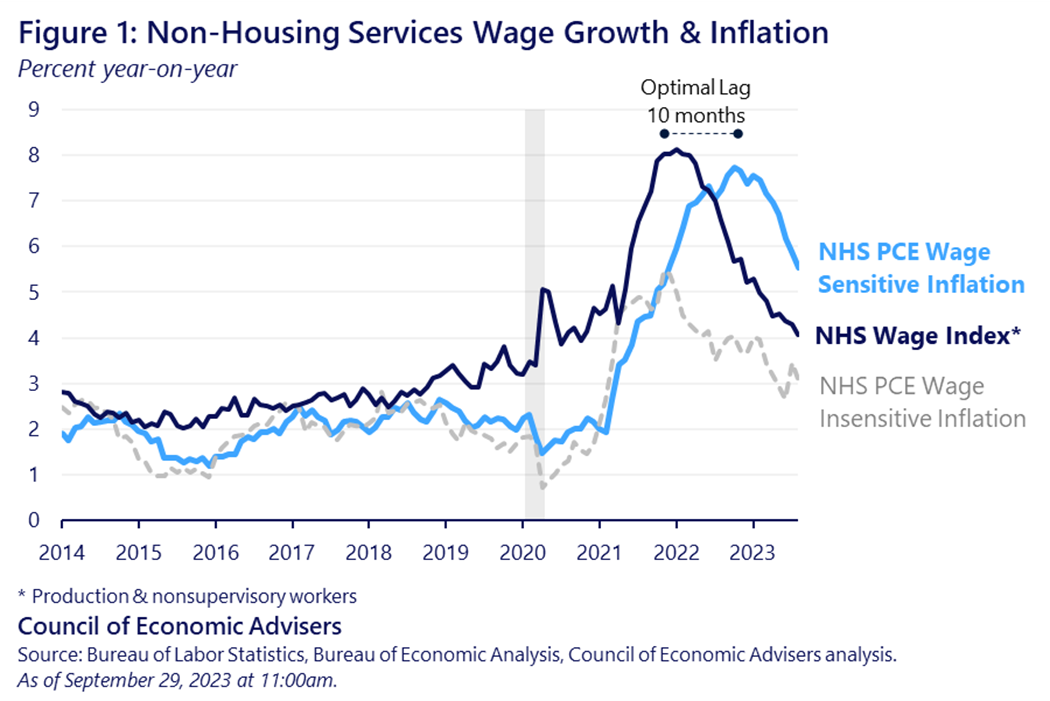
- Wage-sensitive NHS is still the largest of the four major contributors to year-on-year core PCE inflation that we track, but it is less of a driver in more recent months. Core PCE inflation was 3.9 percent year-on-year in August. Of that, wage-sensitive NHS contributed 1.3 percentage points, about the same as housing and more than wage-insensitive NHS (1.1 percentage points), and core goods (0.1 percentage point). Nevertheless, this wage-sensitive contribution has fallen by a quarter since last October, when it contributed 1.8 percentage points to core inflation (see Figure 2).
As noted, wage-sensitive NHS inflation has been lower in more recent months. Three-month annualized core PCE inflation—which is a better measure of more recent price dynamics but also tends to be more volatile—was 2.2 percent in August; of this, wage-sensitive NHS contributed 0.6 percentage point, less than housing (1 percentage point) and below wage-insensitive NHS (1.4 percentage points).
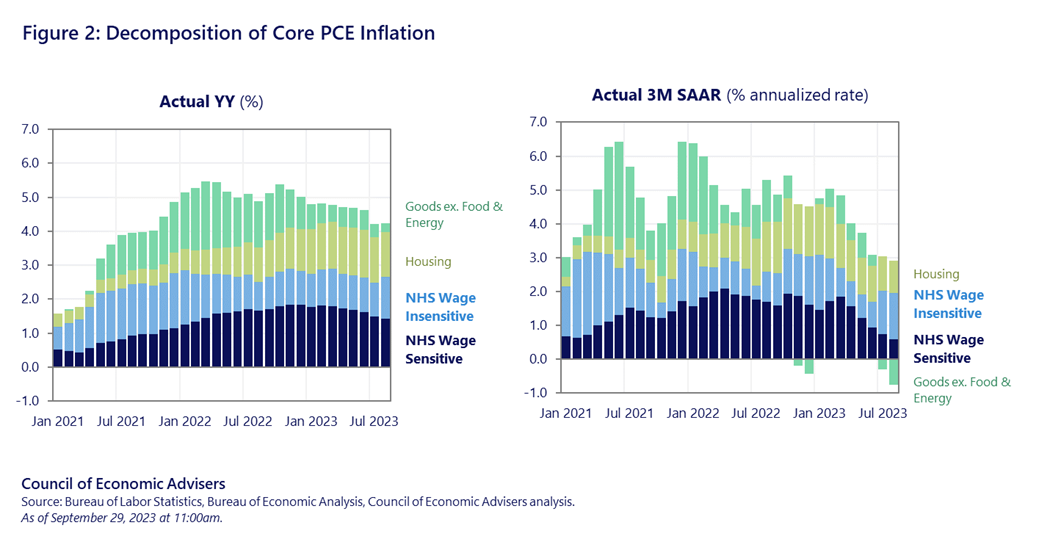
- In August, wage-sensitive NHS inflation was slightly below its 2018 average on a three-month annualized basis. Since core PCE inflation averaged 2.0 percent over 2018, benchmarking each component to their 2018 contributions is a simple way to try to gauge “excess” inflation (see Figure 3).
For example: core PCE inflation was 2.2 percent in August on a three-month annualized rate, suggesting 0.2 percentage point of excess inflation. Of that, wage-sensitive NHS contributed negative 0.1 percentage point—meaning that wage-sensitive NHS contributed slightly less to three-month core in August than it did in 2018. Housing explained 0.4 percentage point of this excess, and wage-insensitive NHS 0.5 percentage point. Core goods inflation was deeply negative, subtracting 0.7 percentage point from August’s excess inflation.
A Brief Word on Housing Inflation
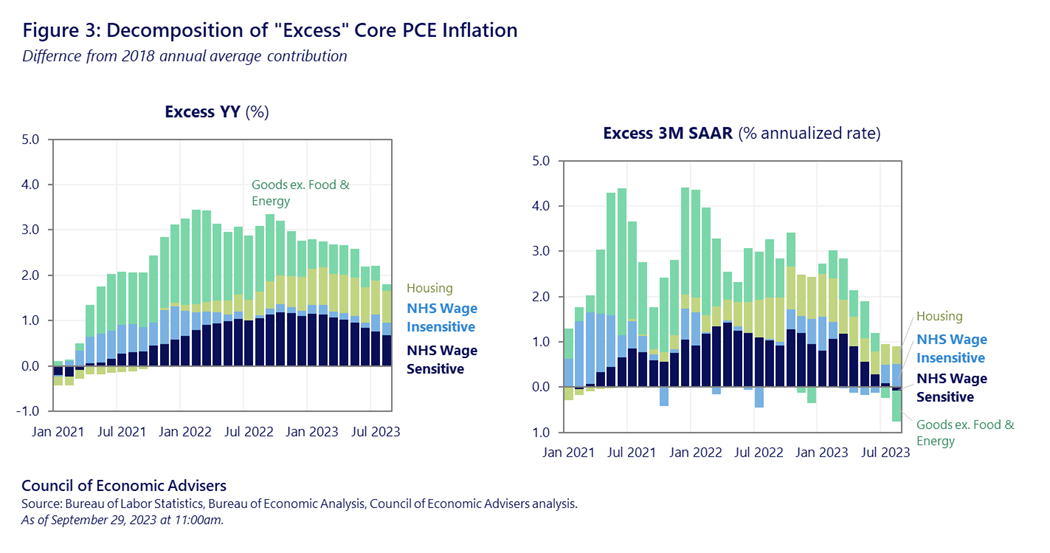
The figures above show that housing is still a large contributor to excess inflation, especially year-over-year. In the government’s inflation indices, housing costs are measured not as the purchase price of homes, but as rents, including owner’s equivalent rent (the CEA explains the details in this earlier post). Prepandemic, housing rents in consumer price index (CPI) and PCE would grow about 0.3 percent a month. Since housing makes up a third of CPI, that suggests housing would normally add 0.1 percentage point to monthly inflation, and 1.2 percentage points to annual inflation.
Figure 4 below shows that housing inflation rose strongly in 2021 and by mid-2022 was growing at 0.7-0.8 percent a month in CPI, nearly triple its 2019 pace. And because of the way housing is measured in our price indices (see link above), it reflects market dynamics from a year earlier. In 2021, long-running housing supply shortages in both owner and rental housing were colliding with pandemic increases in churn.
However, in late 2021 and early 2022 the growth in new rents began cooling. In 2023 we started to see that reflected in the housing CPI data. In August, housing inflation came in at 0.4 percent for the month, having climbed down from most of the rise we saw in 2021 and 2022. The CEA has a model of housing inflation that we have maintained and published for about a year now, driven in part by lags of market rent data. Our forecast has closely tracked the actual data, suggesting that housing inflation should continue gradually falling for the rest of this year and into early next year.