Wage Sensitivity in Non-Housing Services Inflation
Though inflation remains elevated relative to prepandemic levels, it has slowed over the last year. Annual personal consumption expenditures (PCE) inflation has fallen from 7.0 percent last June to 4.3 percent in the latest release for April. Core inflation—which strips out the volatile food and energy components and is typically a better predictor of future overall inflation—has also slowed, but less so than overall: core PCE inflation has fallen from a peak of 5.4 percent last February to 4.7 percent in April.[1]
Much recent analysis has tried to explain this “stickiness” of core inflation and, in doing so, turned attention to non-housing services (NHS) inflation. Core inflation can be divided into three broad buckets: core goods, housing, and NHS. As Figure 1 shows, core goods inflation has declined from its peaks last year, in line with signals of healing supply chains. While housing inflation is still elevated, recent market rent data suggest gradual easing later this year. But NHS inflation remains higher than prepandemic and has seen little improvement.
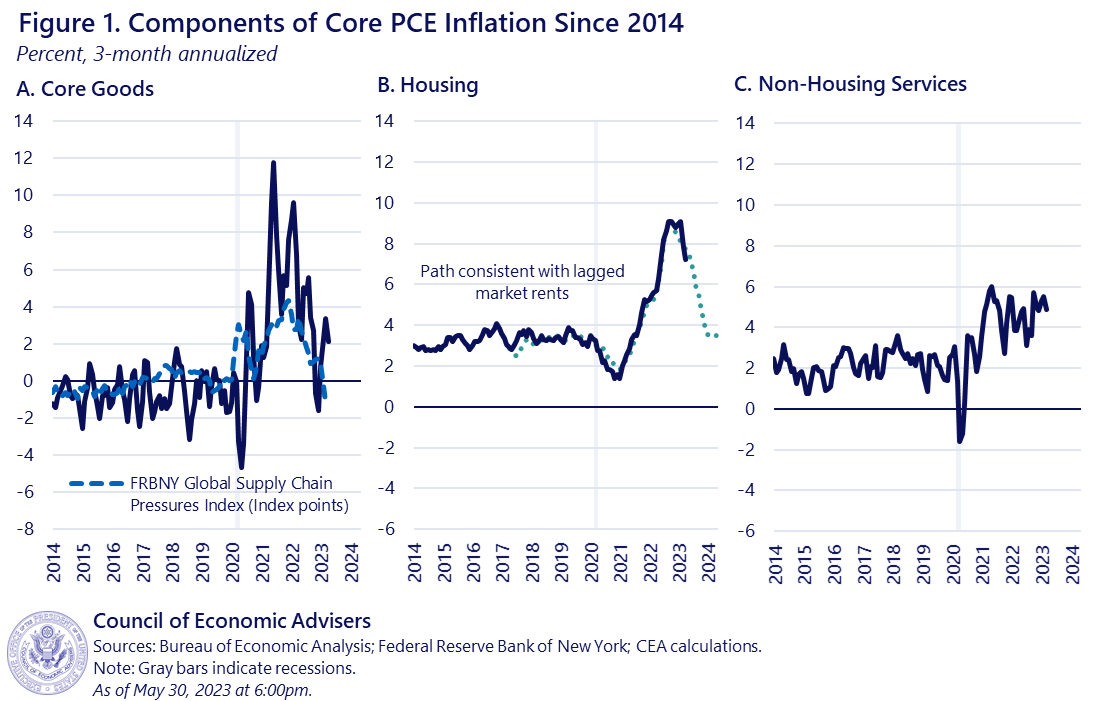
Since services tend to be more labor-intensive than manufacturing, one key question raised by the stickiness of NHS inflation is its relationship to wage growth. Back in February, the CEA introduced a measure of wages called “NHS Average Hourly Earnings (AHE)” designed to weight wage growth in different industries in a way most relevant to NHS output. The CEA found that out-of-sample forecasts of NHS inflation using NHS AHE were more accurate than ones using conventional wage measures like overall AHE (from the BLS Establishment Survey) or the Employment Cost Index (ECI). The CEA tentatively concluded that the recent declines in NHS AHE wage growth provided suggestive evidence that NHS inflationary pressure may begin to cool in the near future, though as the rightmost panel of Figure 1 above shows, this has not yet occurred.
This blog post presents a more disaggregated analysis of wage sensitivity in NHS inflation and reinforces our earlier conclusions. Wage-sensitive components (defined below) make up just over half of NHS consumption but explain more than all of the excess NHS inflation over the past year. We estimate that, on average, price inflation in wage-sensitive NHS categories lags wage growth in those same categories by 10 months; since nominal NHS AHE wage growth has declined considerably since early 2022, this suggests pressures on wage-sensitive NHS inflation could ease in coming months. However, we underscore that these dynamics are uncertain. Wage-sensitive NHS inflation has fallen some in recent months, but the linkage between NHS wages and inflation is a novel area of inquiry and not well understood. Moreover, both the wage-sensitive and wage-insensitive components of NHS can be affected by non-wage factors, whose behavior are another key uncertainty.
Approach
Identifying the wage sensitivity of NHS inflation is complicated by the fact that this inflation component reflects a motley blend of industries that are not uniformly labor-intensive: restaurants, airlines, hospitals, casinos, nonprofits, banks, law firms, etc. To overcome this hurdle, the CEA individually modeled the wage sensitivity of more than 100 detailed NHS PCE component indices. The methodological appendix has further detail, but in brief, we identified “wage-sensitive” NHS components using a quarterly Phillips Curve model with controls for NHS AHE wage growth,[1] as well as expectations and supply factors. Components with positive and significant estimated coefficients on wages were classified as “wage sensitive,” while all other components were “wage insensitive.” Of the 111 detailed indices the CEA examined, 55 were designed as wage sensitive, representing 56 percent of nominal NHS expenditures. Note that this approach is agnostic as to why a component is wage sensitive, e.g., due to rising labor costs, higher pass-through, relatively stronger demand, or something else entirely.
Results
The CEA’s results shed light on NHS inflation in a number of ways.
First, the sectors our approach classified as wage-sensitive were broadly unsurprising. Wage-sensitive sectors include motor vehicle maintenance, day care, laundry and dry cleaning, and several gambling-related components like lotteries and casinos. Among wage-insensitive sectors are health insurance, pension funds, and water and sewage service.
Second, even though wage-sensitive sectors make up only a bit more than half of NHS spending, they explain:
- 41 percent of total annual core inflation in April 2023 (1.9 percentage points of 4.7 percent);
- 43 percent of the “excess” annual core inflation (components relative to their 2018 averages); and,
- more than all of the excess annual NHS inflation relative to 2018 averages.
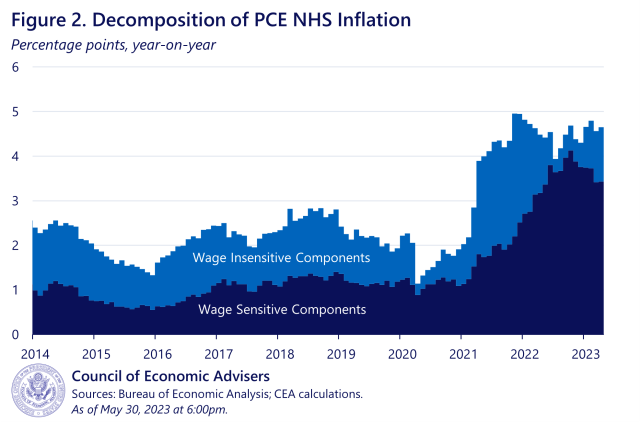
Figure 2 just focuses on the level of NHS inflation, decomposing it into our wage-sensitive and -insensitive pieces. The figure demonstrates that while the initial pandemic runup in NHS inflation was driven disproportionately (though not entirely) by the wage-insensitive components, more recently the vast majority of NHS inflation is among wage-sensitive sectors. Year-on-year inflation in that category has only just started to decline.
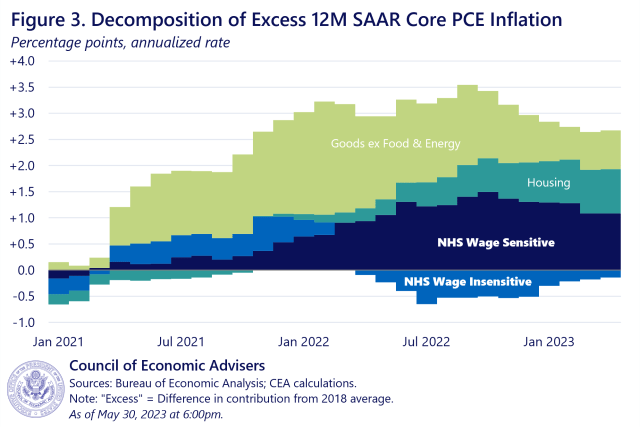
Moreover, while the level of NHS inflation as shown in Figure 2 is still seeing positive contributions from both wage-sensitive and -insensitive components as of April, the rise in NHS inflation relative to prepandemic norms is now entirely driven by its wage-sensitive components. And when looking at core overall, wage-sensitive NHS is now a bigger contributor to excess core inflation than housing or core goods. Figure 3 shows the contributions of the broad core buckets to inflation, relative to each component’s 2018 average when overall core inflation ran at roughly 2 percent. When a bar is positive, that component is contributing more than it did in 2018 (thus, if all the bars were 0, core inflation would be exactly at 2018 levels). Since year-on-year core PCE inflation was 4.7 percent in April, the figure breaks down about 2.5 percentage points of excess inflation that month. Wage-sensitive NHS inflation contributed more than a full percentage point to excess core inflation in March—more than housing and core goods—whereas wage-insensitive NHS inflation was actually a quarter point below its 2018 average. Put another way, the wage-sensitive components explain more of excess core inflation in April than housing or core goods do, and more than all of the excess NHS inflation.
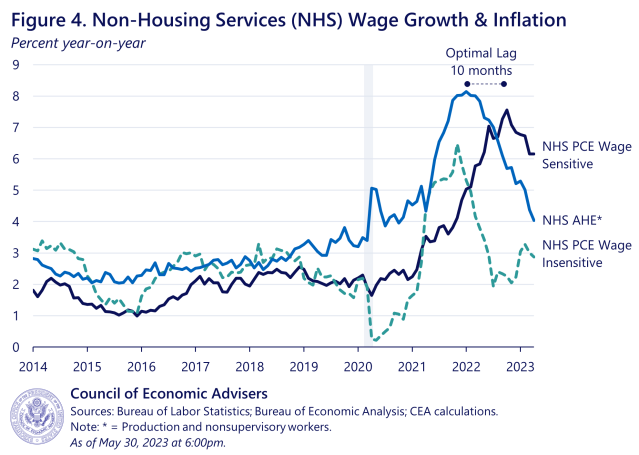
Third, wage-sensitive NHS has cooled from its peak, and there are some signs that suggest it could cool further. Figure 4 below shows 12-month rates of price inflation in the wage-sensitive and wage-insensitive NHS sectors, as well as the 12-month rate of wage of inflation in all NHS sectors. The CEA finds that the predictive power of the wage measure for price inflation is maximized at a lag of 10 months (correlation of 0.74). This is important, because 10 months ago, NHS AHE wage growth was only down less than a percentage point from its January 2022 peak. In April 2023, however, it was down more than 4 percentage points from that peak. That may indicate that more cooling in wage-sensitive inflation is forthcoming. However, we underscore our uncertainty, due to the novel approach in a diverse sector, along with the fact that wage insensitive inflation could re-accelerate (as was the case earlier in the pandemic), mitigating the impact on overall NHS inflation.
In conclusion, the CEA finds that wage-sensitive components of NHS inflation make up just over half of NHS PCE consumption but explain more than all of the excess NHS inflation over the last year relative to prepandemic target. Price inflation in the wage-sensitive sectors of NHS lags wage growth in those sectors by around 10 months, which, given recent declines in NHS wage growth, suggests the possibility of a slowing in price inflation in those sectors in the months ahead. However, the response of overall NHS inflation is uncertain due to our limited understanding of the dynamics of this diverse sub-index as well as the volatility of wage-insensitive NHS components. We will therefore closely track incoming data to test the validity of this hypothesis.
[1] The Consumer Price Index (CPI-U) has seen similar declines over this period. We focus on PCE inflation in this blog post due to the outsized effects CPI’s measure of health insurance prices is having on NHS in recent months.
[2] NHS AHE outperformed other conventional wage measures at the 90% significance threshold, but was about in line with others at the stricter 99% threshold. See the appendix for more details.
Methodological Appendix
Wage-Sensitive NHS PCE Index
The CEA’s wage-sensitive NHS PCE index is the Törnqvist aggregate of the NHS PCE price indexes the CEA identifies as wage sensitive. Wage sensitivity is determined through the use of a quarterly Phillips Curve model based loosely on Yellen (2015).
The CEA estimates an autoregressive distributed lag (ARDL) model for each NHS PCE subcomponent Pi in quarter q:

Where each term is defined as follows
CEA’s NHS AHE wage series (preferred specification) or an alternative wage series (sensitivity analysis).
WTI oil price, quarterly average
Relative nonenergy import prices, calculated in same manner as Yellen (2015)
10-year PCE inflation expectations, from the Federal Reserve Board’s FRB/US release
A vector that includes a linear time trend and pandemic dummies for each of the first three quarters of 2020
The lags m, n, r, and s are optimized for each Pi to minimize the AIC. The sample runs from 1990 Q1 to 2022 Q4.
All subcomponents Pi start out being deemed wage insensitive. A subcomponent switches to being wage sensitive if the linear combination is both positive and meets the significance threshold. For our baseline analysis, CEA sets a 90% significance threshold, and then performs a sensitivity analysis at the 99% level. Both the wage-sensitive and -insensitive components are then aggregated at the monthly level for the purposes of CEA’s inflation analysis.
SENSITIVITY ANALYSIS
The CEA conducted a sensitivity analysis along two dimensions: first, using a variety of alternative wage measures instead of NHS AHE, and second, raising the statistical threshold for wage sensitivity to 99% significance rather than 90%. Appendix Table 1 below summarizes this exercise. At the 90% level, wage-sensitive components identified using NHS AHE both comprised a larger share of the NHS PCE basket than when using other wage measures, and explained a greater share of excess year-on-year core inflation in April 2023. At the 99% level, the four non-ULC wage measures were much closer both in their basket and their excess inflation shares, each comprising roughly 1/3 of NHS PCE and explaining about 80% of excess inflation in April.
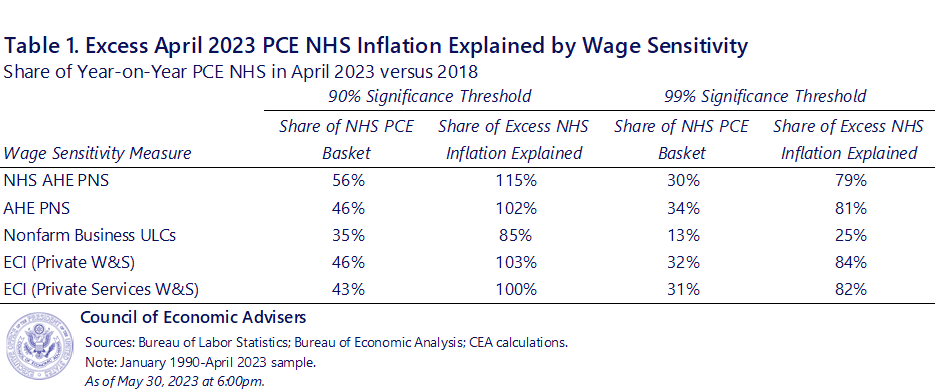
The CEA also explored an alternative model that added lags of real consumption growth for each category to control for demand changes. This might help distinguish between the labor cost passthrough and income effects mechanisms for wage growth to affect inflation. Under our preferred specification using NHS AHE at a 90% significance threshold, wage-sensitive components comprised 55% of NHS PCE and explained 107% of excess inflation in April 2023 (compared to 56% and 115% in the model featured in the text).

