
The Employment Situation in September
In this morning’s jobs report, we learned that payrolls were up by a strong 336,000 last month, well above expectations, and the unemployment rate held steady at 3.8 percent. Upward revisions of over 100,000 to July and August’s payroll gains took the average monthly gain over the past three months up to 266,000.
We always want to avoid reading too much into any one month, and in this regard, this stronger-than-expected report does not reverse the conventional take that the job market has been cooling in recent months. A year ago, the average monthly gain over the past three months was 423,000, well above the comparable number for this month (266,000). See CEA’s X thread for our broader take on the report.
In this blog, we wanted to briefly focus on a number tracked by labor market analysts known as the breakeven number, or BE. Here’s what the BE is, why it’s an important guidepost, how it relates to the monthly employment reports, and why it can be hard to accurately measure.
The BE is the number of payroll jobs the labor market would need to create each month to absorb the increase in the labor force, while keeping the unemployment rate constant. Labor force growth reflects the growth in the population as well as changes in its demographic composition (e.g., age, gender) over time. Because population and labor force growth can be hard to accurately measure in real time, calculating a reliable BE can also be tougher than you might think.
If the labor force participation rate (LFPR; the share of the population in the labor force) is unchanged, but the size of the population grows—which it usually does month-to-month in the United States—then the BE will be positive. Consider this example: imagine that in one month the working-age population is 10 people, 5 of whom are working and 5 of whom are not in the labor force at all (to keep it simple, we’re assuming no unemployment). The LFPR is 50 percent. Now, imagine that the next month nothing changes except the population doubles to 20. With these 10 extra people, we would need 5 more jobs to keep the LFPR from falling and the unemployment rate from rising, since without those added jobs the LFPR would fall to 25 percent (5/20). In this example, the BE equals 5.
In the real world, BE computations must account for a number of factors that influence population growth, changes in labor force participation, and differences in two surveys that comprise the monthly jobs report (see the Appendix for more). While different analysts make different assumptions about these factors, most estimates of the short-run BE today come in at around 100,000 per month.
As the above notes on today’s report make clear, actual monthly job growth has been well ahead of 100,000. Over the past year, the average monthly job growth has been 266,000.
What does this mean for the job market? The logic of BE implies that if actual job growth surpasses the BE, unemployment should fall. But over this period wherein actual monthly job gains have in fact done so, unemployment has wiggled around in a quite narrow range, from 3.4 to 3.8 percent. What gives?
The answer is faster-than-trend labor force growth. Despite the headwinds of an aging population, the labor force participation rate has trended up over the past year, from 62.2 percent in September 2022 to 62.8 percent last month. As we’ve recently discussed on this page, the age-adjusted labor force participation rate is historically high, and today’s report showed the prime-age LFPR to be 83.5 percent, half-a-point above its prepandemic level and its highest in over 20 years. This growth likely reflects the persistently strong labor market pulling in workers from the sidelines as well as immigrant labor flows recovering to normal levels, post-pandemic.
The punchlines are that we have a robust labor market that continues to provide employment opportunities for a labor force that is growing faster than its prepandemic trend. This is a key factor supporting the macro economy as the strong labor market is contributing to rising pay, which in turn is helping to fuel consumer spending, which is almost 70 percent of nominal U.S. GDP. Still, as the business cycle proceeds, we expect job growth to cool and to get closer to the BE. If and when that occurs, it will be worth remembering that this pace of steady-state growth is what is required to absorb the growing labor force without higher unemployment.
Data Appendix: Calculating the BE
Let:
- POP = population 16+
- LF = labor force
- EHH = household employment
- EPAY = payroll (establishment) employment
Then, the identity for the level of payroll employment can be written as:
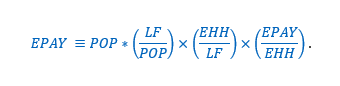
In other words,
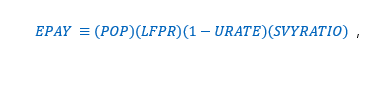
Where:
- LFPR = Labor force participation rate;
- URATE = Unemployment rate;
- SVYRATIO = Survey ratio (ratio of payroll employment to household employment).
The breakeven rate (BE) is calculated as the change in payroll employment, holding the unemployment rate constant. If the labor force participation rate and the survey ratio are also constant, then the BE can be calculated using the monthly change in population as:
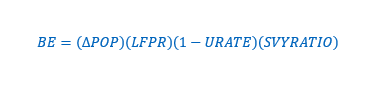
Changes to any of these variables will affect the calculation of the BE. For example, aging of the population has a negative impact on the labor force participation rate; declining LFPR reduces the BE. More rapid immigration increases population growth, increasing the BE. The survey ratio reflects differences in how the payroll and household surveys account for such factors as multiple job holding and agricultural employment. Finally, measured differences in population growth or the survey ratio that are later accounted for in data revisions can have a temporary impact.