
Federal Revenues After the 2017 Tax Cuts
This blog post considers the effect of lower tax revenues on both the 2023 deficit and on deficits dating back to the enactment of the 2017 Tax Cuts and Jobs Act (TCJA).
2023 Revenues and Deficit
While we do not yet have official data for FY 2023 from OMB and Treasury, estimates from the Congressional Budget Office suggest that a decline in major tax revenues was the largest driver of the increase in the deficit from 2022 to 2023.[1] In fact, non-interest outlays held roughly steady as a share of GDP, and discretionary spending programs (that is, spending excluding mandatory items like Social Security, Medicare, and Medicaid) actually fell as a share of GDP.
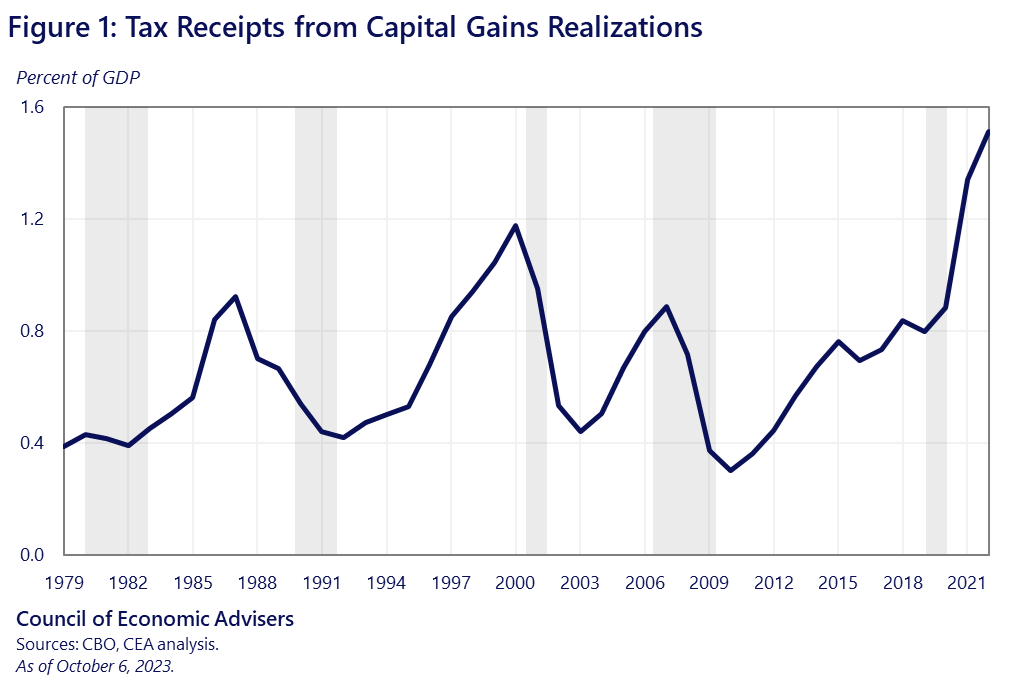
Some of the revenue decline is attributed to a fall in tax receipts that had been unusually elevated earlier in the pandemic in a manner that masked the lower tax revenues that were widely projected following the passage of the TCJA. Most notably, capital gains realizations were historically high in fiscal year 2022 (Figure 1), due to strong market returns earlier in the recovery — leading revenues in 2022 to be higher than in the post-TCJA revenue projections. Indeed, in February of this year, CBO projected that capital gains receipts would fall as a share of GDP in fiscal year 2023, beginning to return towards the levels projected after the TCJA passed.
Longer-Term Impact of TCJA on Structural Deficit
Even adjusting for extraordinary capital gains, however, the level of the deficit and of revenues this year is unusual given the strength of the economy, a development that we expect is related to the revenue-reducing impact of the Tax Cuts and Jobs Act (TCJA).
The unemployment rate averaged 3.6% over fiscal year 2023, an extraordinarily low level. Economic growth has also surprised to the upside: in December of last year, the average private sector forecast in the Blue Chip consensus foresaw real GDP shrinking slightly over 2023. The latest average forecast is for 2.1% growth over 2023, a solid growth rate.
Figure 2 illustrates movements in CBO’s unemployment gap (the difference between the unemployment rate and CBO’s estimate of the noncyclical rate) and the primary (non-interest) deficit as a share of GDP, which have broadly tracked together over time. When the economy weakens, deficits rise because incomes fall, weakening revenues, while spending on economic assistance goes up. When the economy is strong, the reverse happens: deficits fall because incomes rise, generating more tax revenues, and assistance spending declines.
After the passage of the TCJA in 2017, however, this relationship shifted. While deficits still tend to shrink as the unemployment rate falls, the deficit became higher for any given level of unemployment. Note, for example, that at the end of the figure, the wedge between the unemployment gap and the deficit is much larger relative to the pre-TCJA period.
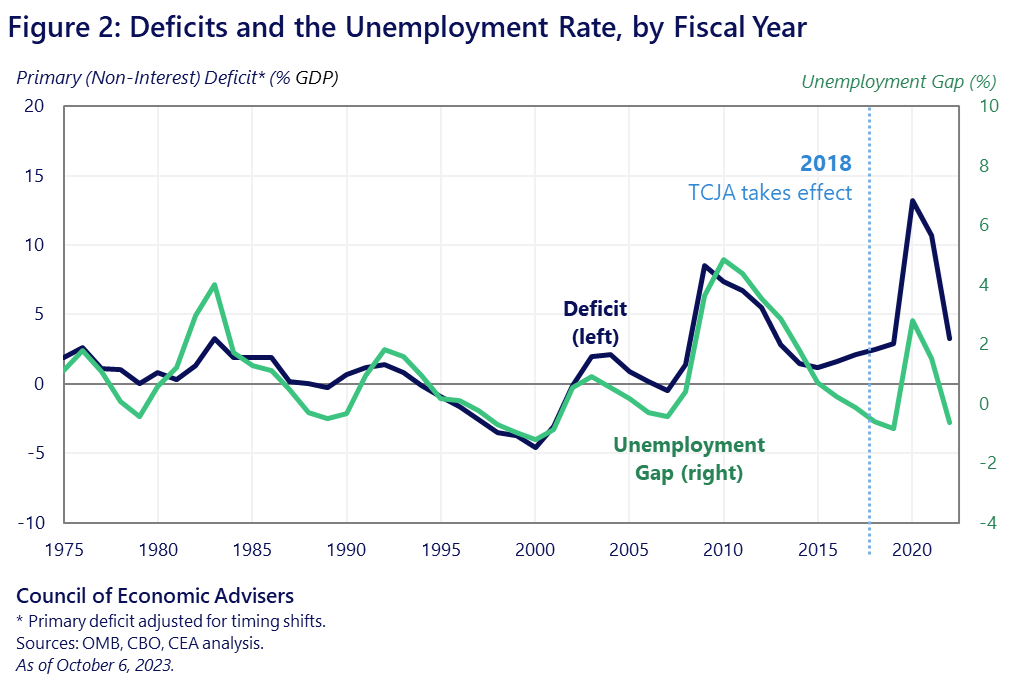
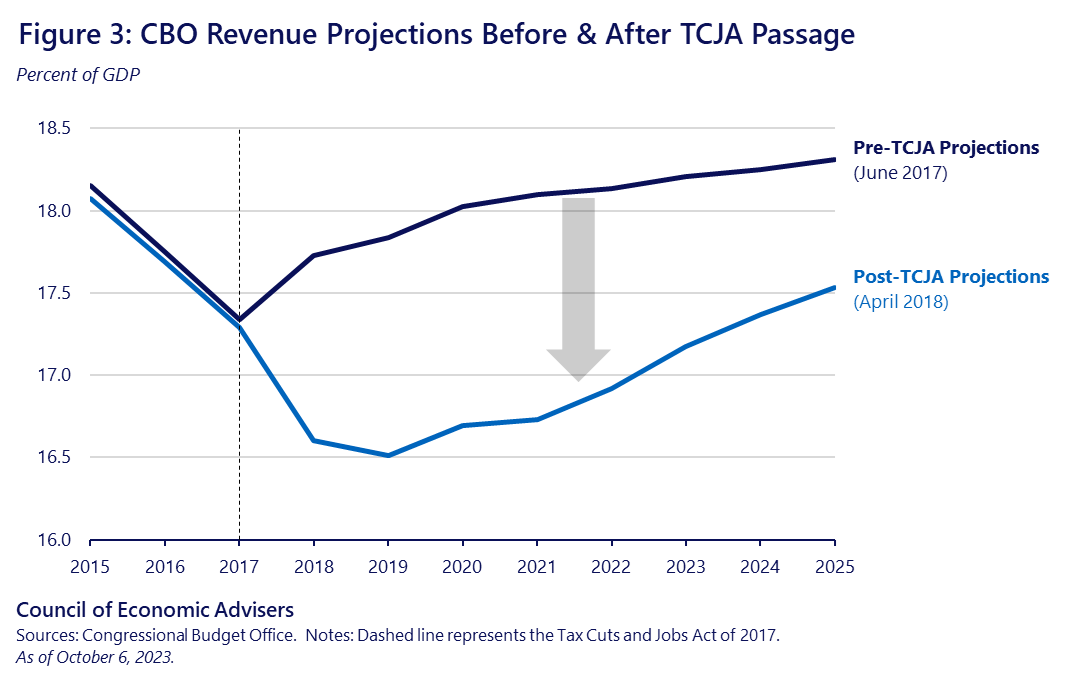
Figure 3 presents another view of the revenue impacts of the TCJA. Prior to the TCJA, CBO assumed that steady economic growth would lead revenues to come in slightly above 18% beginning after 2020. But the tax cuts significantly lowered that projection; in their subsequent forecast after the TCJA was enacted, CBO projected revenues in 2025 that were more than a percentage point of GDP lower than in their earlier, pre-TCJA forecast and similarly lower revenues as a share of the economy for 2023 that were broadly in line with the CBO’s estimates released this week.
In conclusion, idiosyncratic factors can raise or lower deficits in any given year, much as capital gains realizations lowered deficits last year. But beyond these one-offs, the structural deficit—the trend deficit absent cyclical effects or idiosyncratic factors—is clearly higher now due to the 2017 tax cuts. The Biden-Harris administration has put forward spending reductions and high-end and corporate tax increases to help lower the structural deficit and realign deficits with their pre-TCJA relationship with the business cycle, lowering aggregate deficits by $2.5 trillion over the next 10 years.
[1] After removing the accounting effects associated with student debt relief and the recent SCOTUS decision, the FY2023 deficit would have been roughly 3.5% of GDP higher than FY2022. The difference between these figures is explained by how student debt cancellation costs are accounted for: the cost is included in the official 2022 deficit, while the SCOTUS decision is reflected in the 2023 deficit. Removing these effects thus reduces the 2022 deficit, increases the 2023 deficit, and results in a larger year-to-year increase.