
Q4 GDP Advance Estimate: Context for Today’s Strong Report
Today’s GDP report showed the US economy expanded at a strong 3.3 percent clip in the last three months of last year. Over the full year, real GDP was up 3.1 percent (2022Q4 to 2023Q4), also a very solid growth rate, supported by the strong labor market, consumer spending, business investment, net exports, and easing inflation. CEA drills further into the report on X.
This post features a series of tables and figures that place today’s report into the context of the current economic expansion by looking at where we were, where many forecasters thought we’d be at this point, and how these developments are helping working Americans. Taken together, the data tell a compelling story of an economy that has significantly defied expectations, and where persistently tight labor markets and easing price pressures are supporting macroeconomic growth amid rising real wages and incomes.
Table 1 shows projections from the Blue-Chip survey of top forecasters in December 2022 and the actual results, including those from today’s report. In the cases of real GDP, unemployment, and real disposable (after taxes and transfers) income, the economy significantly outperformed expectations. While forecasters expected a slight contraction by now, real GDP instead grew by a robust 3.1 percent, year-over-year. Real incomes are growing more than twice as fast as expected. While one might worry above-expected growth rates may be inflationary, the rate of core PCE inflation—the inflation indicator most closely watched by the Federal Reserve—came in only slightly above the forecast over the full year (3.2 versus 3 percent), and at a much slower 2 percent rate, annualized, in 2023Q4.
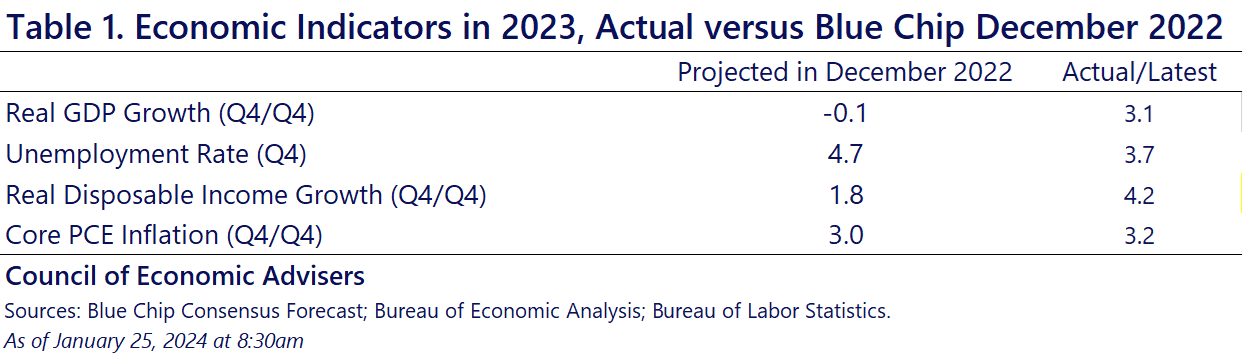
Figure 1 plots the December 2022 Blue Chip forecast and actual real GDP–both indexed to 100 in 2022Q3. It shows how much stronger real GDP growth has been compared to the Blue-Chip consensus expectation. In today’s dollars, that gap amounts to $996 billion, or $2,964 per capita in 2023Q4.
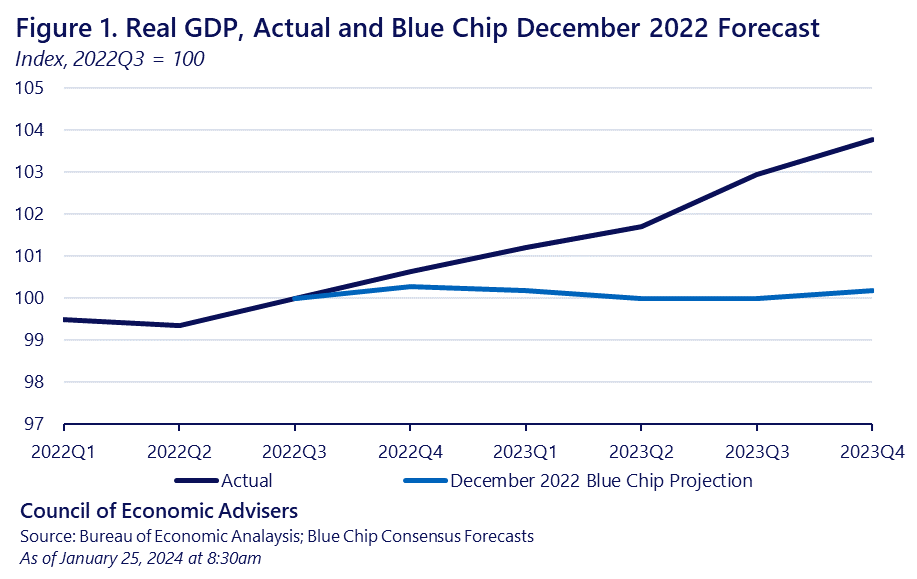
Figure 2 highlights a couple of points that CEA has long emphasized: the combination of tight labor markets and easing inflation support rising real pay, and that, in turn, supports consumer spending (which amounts to about 70 percent of nominal GDP), which contributed 1.9 percentage points to Q4’s 3.3 percent real GDP growth rate. The figure shows monthly growth in total real compensation, which includes the joint effects of job gains (really, aggregate hours of work), nominal wage and benefit gains, and lower inflation. In 2022, any growth in total real compensation was driven exclusively by employment. But in 2023, both job gains and real pay gains per worker (partly due to lower inflation) contributed.
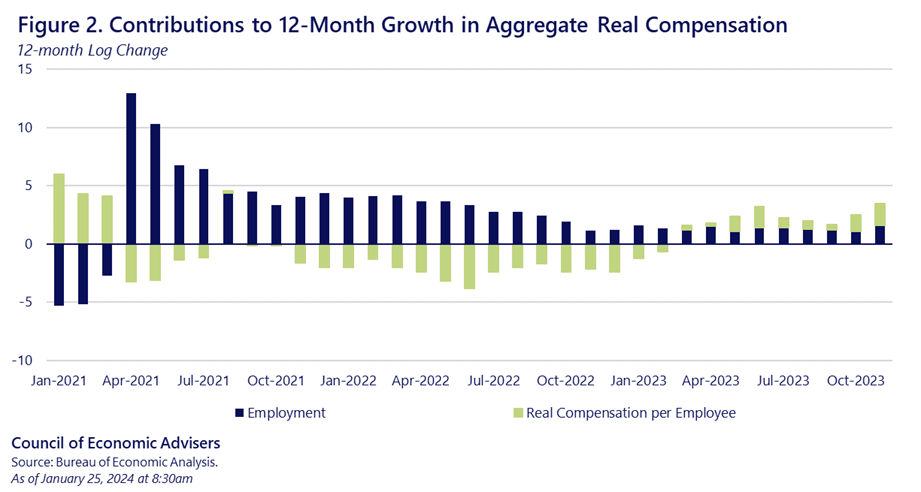
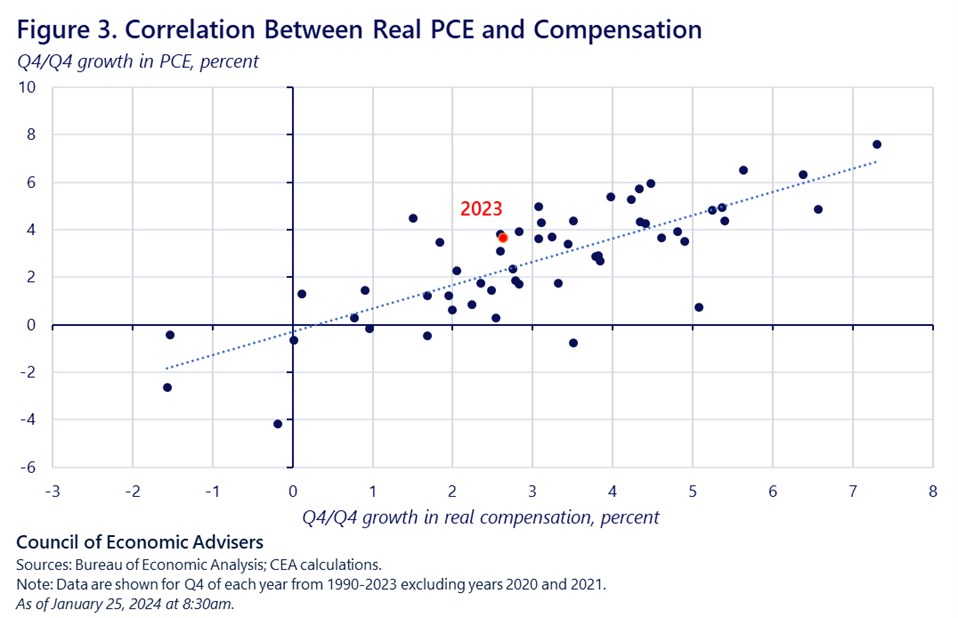
Figure 3 shows the tight correlation (r=0.78) between aggregate compensation and consumer spending, both in real terms, using Q4 over Q4 growth rates since 1990, and excluding the pandemic induced outliers in 2020 and 2021. The plot helps to explain one dimension of what’s powering the current recovery: strong job growth and real pay gains supporting robust consumer spending.
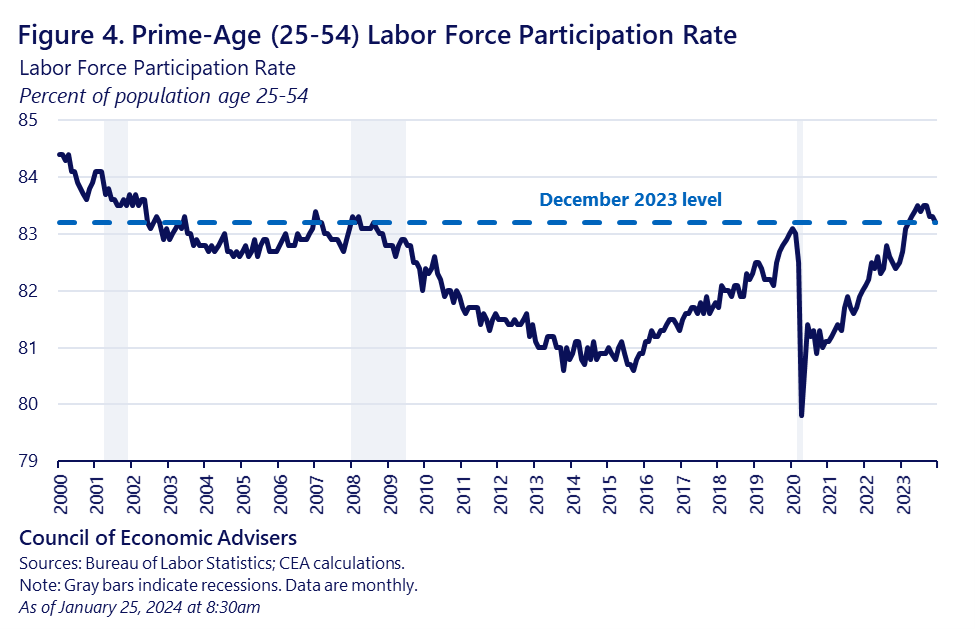
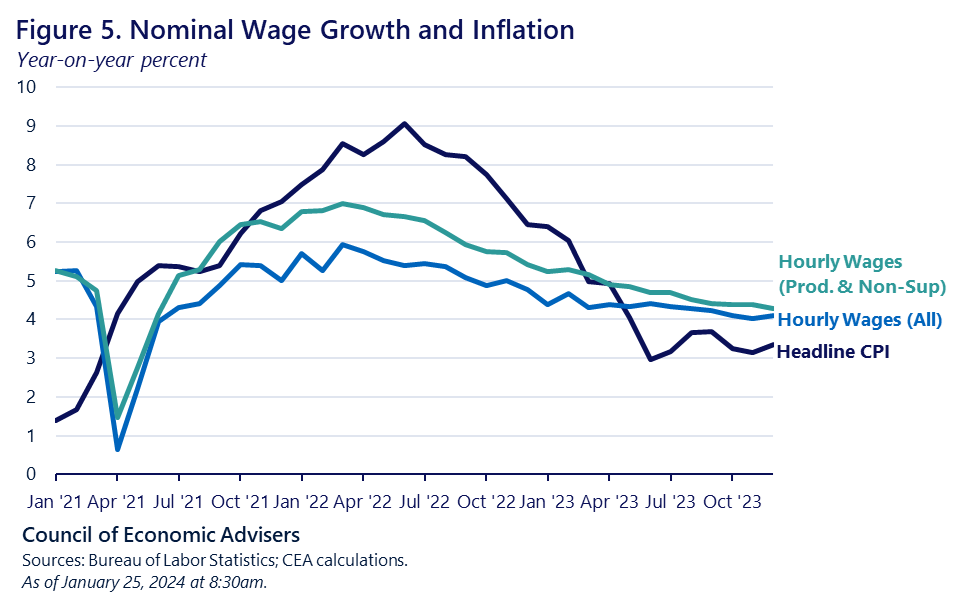
Figures 4 and 5 delve deeper into our strong labor market, which has driven increased labor supply and wage gains that have surpassed price growth for most of last year. These real hourly wage gains are a key ingredient in the positive GDP growth we see in today’s report. Note also that the real gains are stronger for middle and lower-wage workers (labeled production, non-supervisory), a good example of how persistently tight labor markets provide more bargaining power to mid-wage workers.
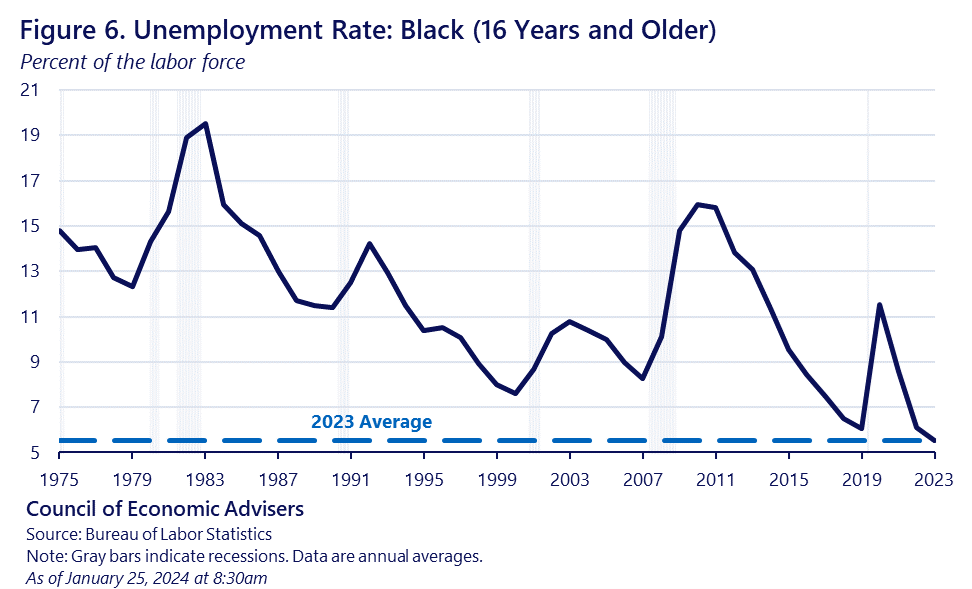
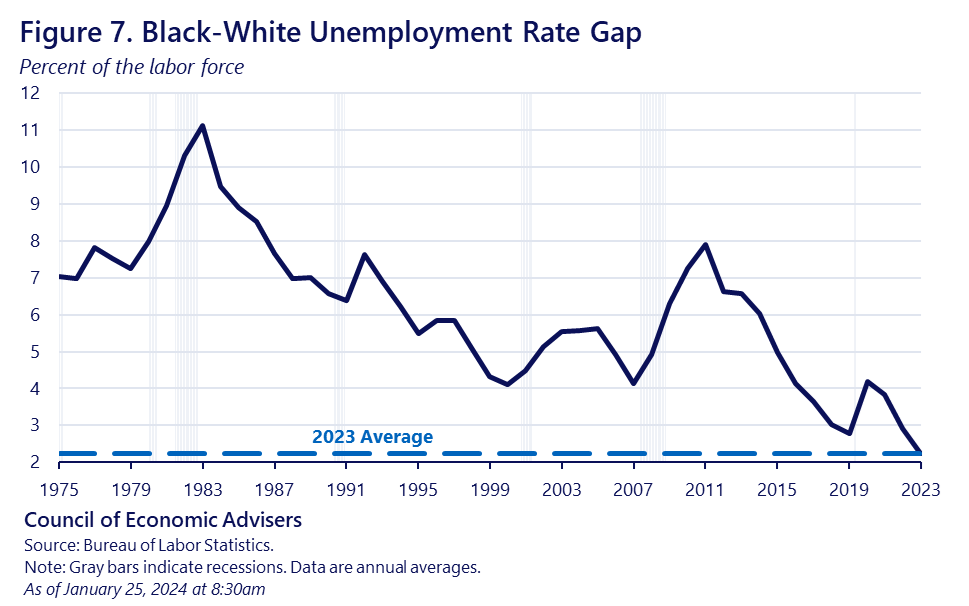
Figures 6 and 7 show just how important the tight labor market has been for Black workers. Their unemployment rate in 2023 of 5.5 percent (annual average) was the lowest on record. The gap between Black and white unemployment rates was also the lowest on record. Such absolute and relative gains provide a potent reminder of one of Bidenomics’ key pillars: empowering workers through full employment conditions.
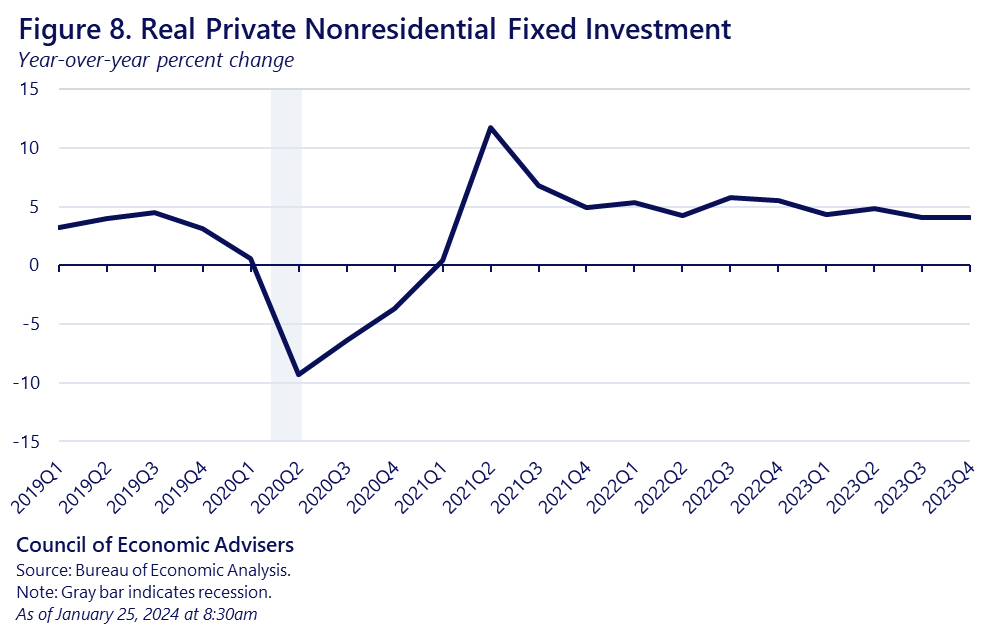
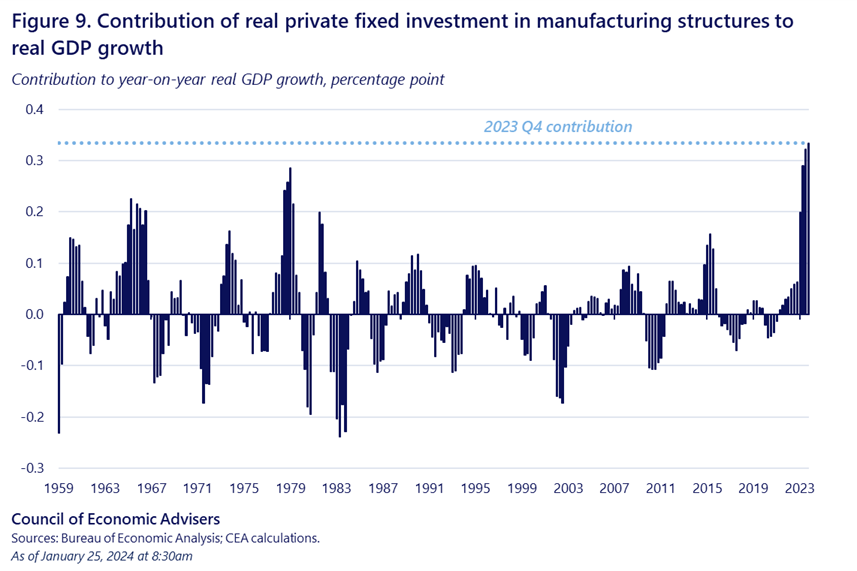
Of course, consumer spending isn’t the only important part of GDP. We learned today that business investment also grew solidly last year (Figure 8). Relative to consumption, business investment represents a smaller share of nominal GDP (about 13 percent), but it is a crucial, forward-looking indicator of potential future growth rates. Strong investment in manufacturing structures (Figure 9), in particular, are clearly related to incentives created by legislation such as the CHIPS and Science Act and the Inflation Reduction Act.
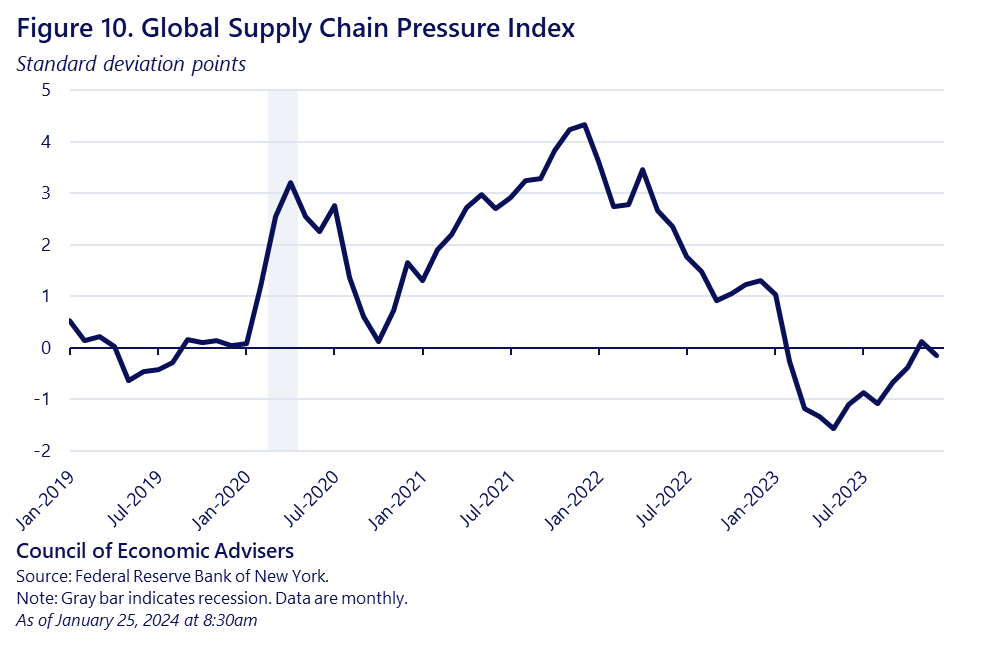
Finally, we note that overall consumer inflation in today’s report was 1.7 percent, the lowest rate for this indicator since 2020Q2. As CEA has shown in other analysis, a big contributor to this disinflation has been the unsnarling of supply chains, as shown in Figure 10, the New York Federal Reserve’s Global Supply Chain index. The fact that this index is back at zero suggests supply chains are broadly back to their pre-pandemic status.
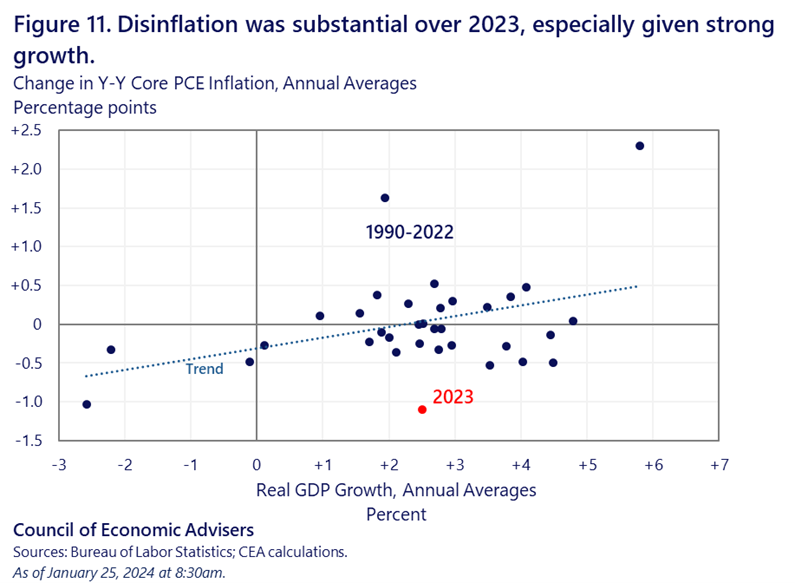
Today’s report provides another example of the historically unique characteristic of the current and recent US macroeconomy: significantly lower inflation amidst strong growth. Figure 11 plots this relationship with the percent change in annual-average real GDP on the x-axis and the percentage point change in annual-average core PCE inflation on the y-axis. The 2023 outlier in red stands out in the chart.
As the President always stresses, our work is not done. Our administration will aggressively pursue our lower-costs agenda, whether in health care, energy, or getting rid of junk fees. But it is notable that this agenda is taking place in the context of strong GDP growth, a tight labor market, and easing inflationary pressures.