
Comments on the May 2023 Consumer Price Index Report
The Consumer Price Index (CPI) rose 0.1 percent in May, down from 0.4 percent in April, while the yearly rate rose 4 percent, compared to 4.9 percent in April, the lowest yearly inflation rate since March 2021. Falling energy prices—down 3.6 percent in May—were the key factor in May’s slower inflation relative to April, as gasoline prices fell 5.6 percent in May, subtracting 19 basis points (hundredths of a percent) from the monthly inflation figure and just under a percentage point from the yearly figure.
Core inflation, which omits food and energy prices, rose 0.4 percent in May and 5.3 percent on a yearly basis. Given that food and energy are critical components of the market basket for households, some may reasonably wonder why economists closely track the core index. The main reason is that their inherent volatility, as well as the fact that price movements of both of these commodities are influenced by global markets, makes them less indicative of where U.S. inflation is headed. In other words, we track the core, and a few other sub-indices, to get a better read on the underlying, or more persistent, component of inflation.
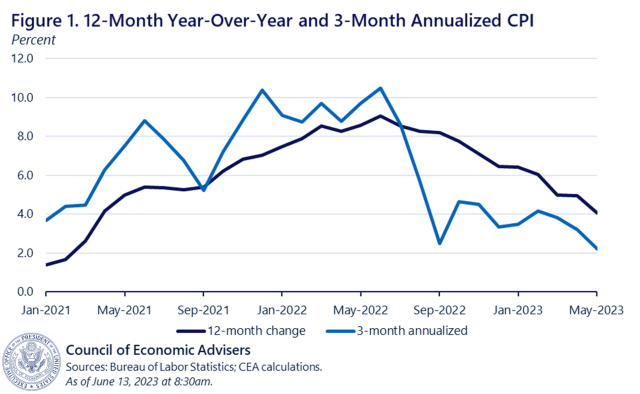
As figure 1 reveals, overall inflation has been falling for a number of months. On a yearly basis (navy blue line), it is down 11 months in a row, and down by 5.1 percentage points from its peak last year of 9.1 percent. Prepandemic, in 2019 (Dec.-Dec.), CPI inflation rose 2.3 percent, so 4 percent is still an elevated yearly inflation rate. But the figure also shows the more timely, though jumpier, three-month annualized rate of overall inflation, which was 2.2 percent in May, a point below April’s three-month annualized rate of 3.2 percent and the lowest such rate since November 2020.
The combination of the persistently strong U.S. labor market and the decline in overall inflation has contributed to inflation-adjusted earnings gains. In May, real average hourly earnings rose 0.3 percent over the month and 0.2 percent over the last 12 months, the first 12-month rise in real earnings since March 2021. In this way, the tight labor market is supporting solid consumer spending, a key variable in terms of sustaining macroeconomic growth.
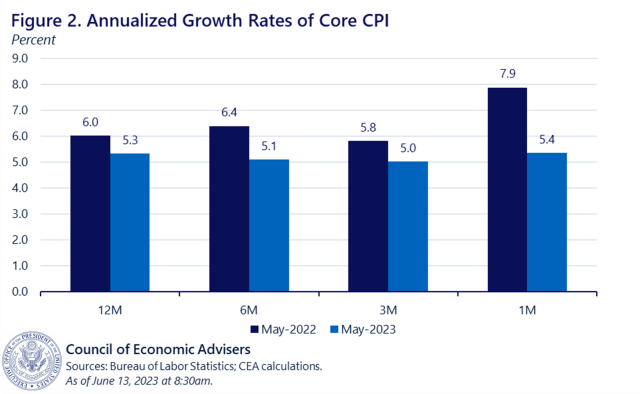
Last month, we argued that a useful way to extract signal from noise in the inflation data is to plot annualized changes from different points in time on a 12, 6, 3, and 1-month basis. Along with the height of the bars showing the level of inflation, bars that trend downward over shorter time periods (e.g., 3 months versus 12 months) signal slowing inflation and vice versa.
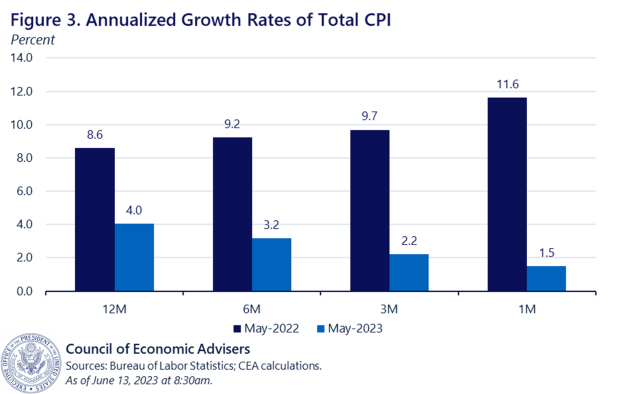
Figure 2 focuses on core inflation, which has come down relative to a year ago, but is still high in level terms and “sticky” in terms of its pace. Figure 3, however, shows clear evidence that overall inflation, including food and energy, is easing both in terms of its level and in terms of its pace of time.
These patterns suggest a bit of a conundrum. Economists tend to view core inflation as a more reliable signal of where inflation is headed. But for a while now, core has remained elevated and sticky while overall inflation has persistently slowed. One “mechanical” reason for this is that energy and food prices have eased in recent months, though within food prices, more so for groceries than restaurants (grocery prices rose 0.1 percent last month after falling 0.5 percent in the prior two months). These price movements reduce overall inflation, but are less of an influence on core inflation (there is some pass through from overall to core, say, through airfares reflecting fuel costs).
Another force in play are housing costs, which account for a particularly large share (61 percent) of 12-month CPI core inflation. Housing costs rose 0.5 percent in May, and 8.2 percent over the past year (versus, say, 3.4 percent over 2019). As the CEA argued in a recent blog post, we expect housing prices to ease as the year progresses. If so, this should especially help ease the pace of core inflation, but there is considerable uncertainty as to when, or to what extent, this rollover might occur.
The patterns depicted in figure 3 above provide some important inflation relief to American consumers and workers. However, as prices remain elevated and core inflation, though down from its peak, has fallen less quickly than overall inflation, our work is not complete. The CEA will continue to closely track these developments as new data come in.