
The Employment Situation in March 2024: Rinse and repeat! A Virtuous Cycle in the Job Market
In another strong jobs report, payrolls rose 303,000 last month, well above the expectation of 214,000 jobs added. CEA takes you through the details of the report over at our X thread, including the tick down in the unemployment rate and the increase in the labor force participation rate. In this blog, we wanted to explore why the job market has repeatedly beat expectations. That is, the above-expectations numbers in March are not unusual in recent employment reports. What is this consistent, one-sided miss telling us about the U.S. job market?
One answer to the question starts with the simple, econ 101 observation that the demand for labor is “derived demand,” meaning it derives from consumer demand for goods and services, as well as demand for investment inputs. As the scatterplot below shows, yearly percent changes in real consumer spending and job growth are unsurprisingly positively correlated. Over much of this current expansion, many forecasters have also low-balled their growth expectations, and this in turn has led to systematically lower job-growth expectations.
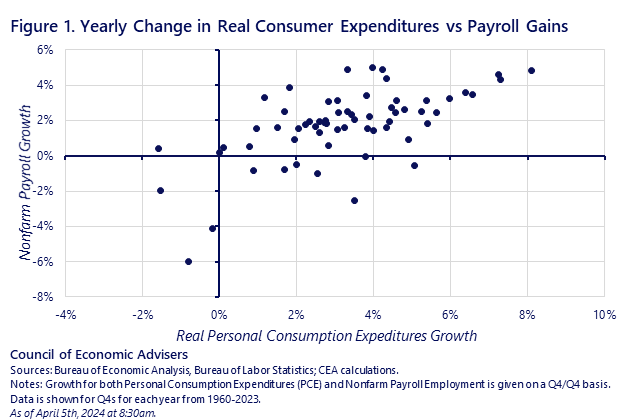
Scatterplots show correlation, not causation, and the one above is no different. Yes, the “derived demand” model argues that solid spending and investment, partly fueled by the strong private sector response to the investment incentives in the IRA and CHIPs legislation, is causally linked to hiring. Businesses need workers to meet the level of demand for their products, and firms that fail to hear this signal risk leaving profits on the table.
But it also the case that stronger employment growth drives greater demand—consumption and investment—by putting more money in people’s pockets. The figure below shows how wage growth has run ahead of price growth for almost a year now. We learned this morning that wages were up 4.1% over the past year. We do not have inflation for March yet (we’ll have that on Wednesday of next week), but in February, it was up 3.2% over the year, well below the recent trend in wage growth.

In other words, the scatterplot represents a virtuous cycle wherein strong job growth supports solid spending and spending supports jobs. Rinse and repeat!
Another important bit of good news in today’s report is that the labor force participation rate ticked up by 0.2 p.p. CEA tends to focus on prime-age workers (25-54 year-olds), as shown in the figure below. Their rate ticked down 0.1 p.p in March, but as you see, it has come back strong in recent years, as the persistently tight labor market has pulled many workers off of the sidelines.

This dynamic of a fast-rising labor force may also help to explain the expectations-defying patterns we’ve seen. In an earlier blog, we discussed this in terms of what labor economists call the “breakeven level of job growth” or BE. Conventional estimates of the BE tend to cluster around 100,000. But over the past year, the average monthly job growth has been 244,000. As we wrote in our earlier blog, “the logic of BE implies that if actual job growth surpasses the BE, unemployment should fall.” But the fact is that actual monthly job gains have far surpassed the BE, while the unemployment rate has been firmly embedded in the 3.5-3.9 percent range (3.8% in March).
The logic of BE tells us that if job gains surpass the BE yet the unemployment rate is broadly stable, the labor force may be growing faster than we thought (see below for additional sources of uncertainty that may complicate the arithmetic). We’ll have more to say about this in future analysis, but many economists looking into this question are suspecting faster labor force growth is a credible explanation for this BE conundrum, which in turn helps to explain the expectations misses.
A final point that should never be neglected in this research is that initial job market data are not the final word. For example, job gains in the payroll survey undergo several rounds of revisions, including a “benchmarking” to administrative data from unemployment insurance tax records. Household survey estimates are derived from a relatively small survey and are subject to error as well. And, both payroll and household survey estimates are revised over several years to account for emerging seasonal patterns. It is therefore possible that some of the divergence between recent payroll estimates and the BE rate could be revised away.
We will continue to carefully track these developments, including the virtuous cycle, labor force growth, and data revisions.