Tracking the Dataflow When It’s Confusing
Tracking economic indicators is challenging at the best of times, but lately it has been especially so, with key variables moving in ways that often differed from what economists expected. Job gains, for example, have often surprised to the upside, as discussed in a recent blog. Real GDP had done the same for a few quarters, though in 2024:Q1 it lagged expectations to the downside (1.6% actual versus 2.5% expected).
Thus, we are once again left trying to pull signal from noise. When we do, we see a strong U.S. economy wherein healthy consumer spending—almost 70% of nominal GDP—is continuously supported by a strong job market and consistent real wage growth. Inflationary pressures, while down significantly from their peak, have not abated, but have seen progress in some key categories. Most importantly, our cost-cutting policy agenda rolls on, with rule changes and legislation targeting lower costs for American households.
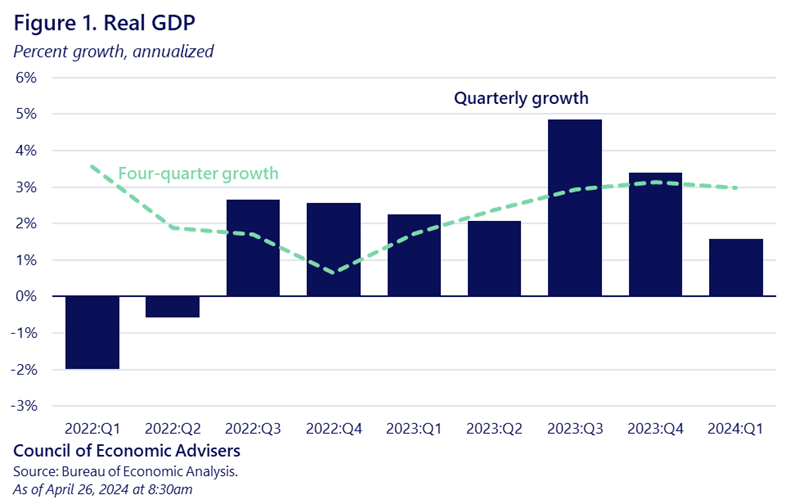
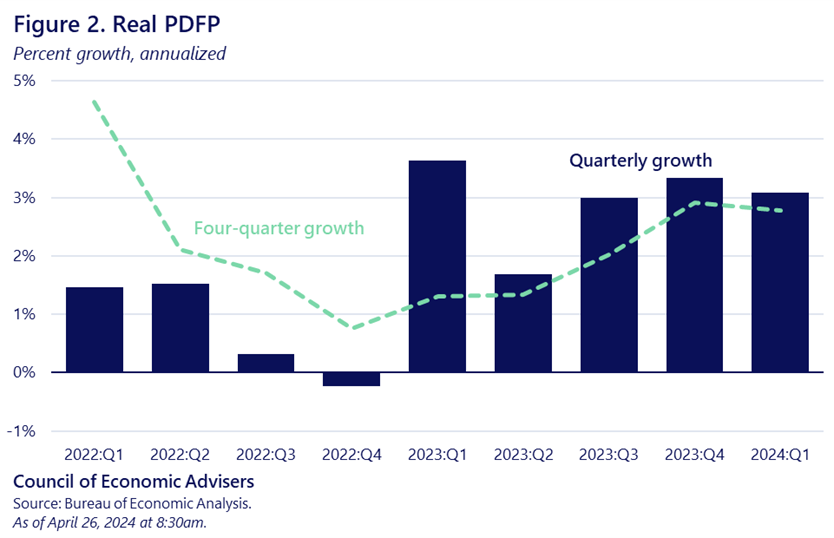
Real GDP, the broadest measure of economic growth, came in at 1.6% in Q1 of this year, below expectations for a stronger report. However, the growth rate reflected negative contributions from the most volatile components of GDP—inventories and net exports. To get a better signal of underlying growth, economists often look at real consumer spending plus private business fixed investment (private domestic final purchases, or PDFP), which grew at an annualized rate of 3.1% over the quarter, about the same as the pace of growth in 2024:H2.
Figure 1 shows one easy way to boost the signal relative to noise: simply plotting annualized quarterly real GDP growth alongside its yearly growth rate, as the latter smooths out some of the noise of the former. Year-over-year, real GDP was up 3% in Q1, about the same as the less noisy quarterly PDFP measure (Figure 2).


We also learned this week that initial Unemployment Insurance claims came in at a value of 207,000 as of April 20th, continuing a historically low trend and underscoring the tightness of the U.S. labor market. In fact, UI rolls, adjusted for the growth in the workforce, have been quietly and persistently hitting historic lows week after week.
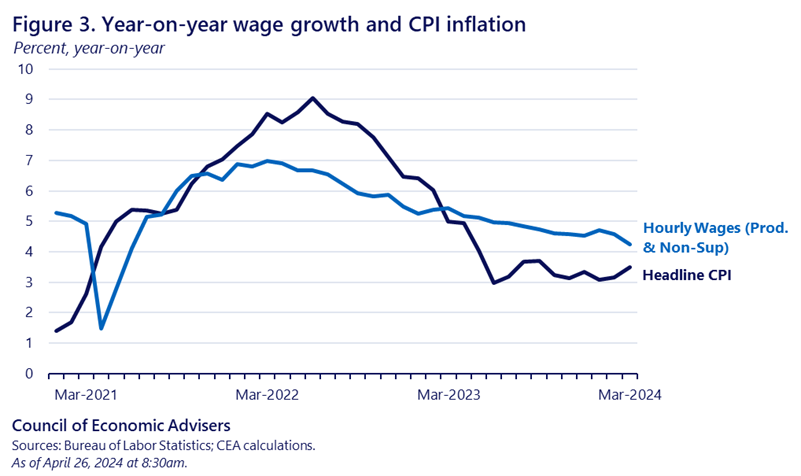
This combination of a tight labor market and, as discussed next, lower inflation relative to earlier in the expansion, has generated real wage gains (Figure 3). On a yearly basis, wage growth for middle-wage workers has exceeded price growth—meaning real wage gains—for 13 months in a row.

Turning to inflation, we learned this morning that the Personal Consumption Expenditure (PCE) price index rose 0.3% in March, in line with expectations. Figure 4 takes a similar approach to Figure 3, plotting annualized monthly rates against yearly rates. The much smoother yearly series shows clear progress: yearly PCE inflation is down 4.4 percentage points from its peak of 7.1% in June of 2022 (to 2.7% in March). However, the yearly series in Figure 4 also shows that inflation fell more quickly in the second half of last year than has been the case in the first quarter of this year.

Some key sources of inflation have contributed to its easing over the last few years. Grocery inflation in the PCE report was flat in March, 0.1% in February, and was up 1.5% over the past year, after rising 7.9% a year ago. Goods inflation has also contributed to overall easing, up 0.1% both last month and over the past year. Upward pressure on PCE has come more from services, which rose 0.4% last month and 4% over the past year.
When trying to extract signal from noise in inflation data, economists focus on core PCE inflation, which leaves out volatile gas and food prices. Core PCE was up 0.3% in March, also in line with expectations. Over the year it rose 2.8%, the same yearly rate as February, and the two months are tied for the lowest core rate since March 2021. Year-over-year core inflation is down 2.8 percentage points from its February 2022 peak, but over the past four months it has toggled between 2.8% and 2.9%.
Putting it all together, the U.S. economy continues to deliver strong job and real wage gains, which in turn is helping consumers generate steady, persistent growth. Inflation is down from its peak, and monthly PCE came in as expected in March. However, inflation has been stickier so far this year compared to the second half of last year, underscoring the need to continue to push on our cost-cutting agenda. Such efforts include negotiating lower prescription drug prices, capping insulin at $35/month, and saving millions of Americans hundreds of dollars per year on health care coverage. The President’s budget would significantly increase the number of affordable homes and lower child care costs. The Administration also continues to target junk fees, as demonstrated by this week’s rule change to ban surprise airline fees.
The dataflow may be, at times, confusing, but CEA will continue to do our best to pull out, amplify, and elevate the signal from the noise.

