
February 2024 CPI Report
We learned this morning that inflation as measured by the Consumer Price Index was 0.4 percent in February and 3.2 percent over the past year. Core inflation, which leaves out volatile food and energy prices in order to better parse inflation’s underlying trend, was also 0.4 percent over the month and 3.8 percent over the last year.
In this blog, we look at a few categories in the CPI report that drive the broad index through the lens of 6-month annualized changes. Because one month of data doesn’t capture the underlying trend, and 12-month measures underweight more recent movements, we prefer using 6-month changes to boost the signal-to-noise ratio without losing timely developments. On a 6-month basis, overall prices were up 3.2 percent and core prices were up 3.9 percent.
We break down core inflation into three components: core goods, core services excluding housing, and housing, and then fill out the picture with a quick look at energy and food inflation.
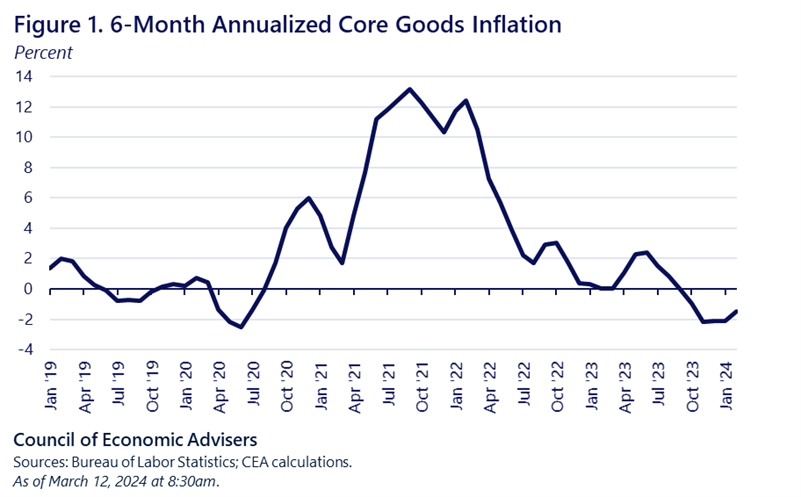
Core goods: As post-pandemic supply chains have unsnarled, goods inflation has significantly eased and was negative from June 2023 to January 2024. In February, core goods prices ticked up 0.1 percent; however, over the past 6-months, prices have fallen in this category by 1.5 percent. The figure shows how core goods prices shot up during the pandemic, posting double-digit inflation, as strong demand for goods collided with constrained supply chains. As supply normalized and demand for goods eased somewhat as well, inflation sharply reversed course. Because core goods account for about 20 percent of the overall CPI and about a quarter of the core, their reversal has been an important source of disinflation.
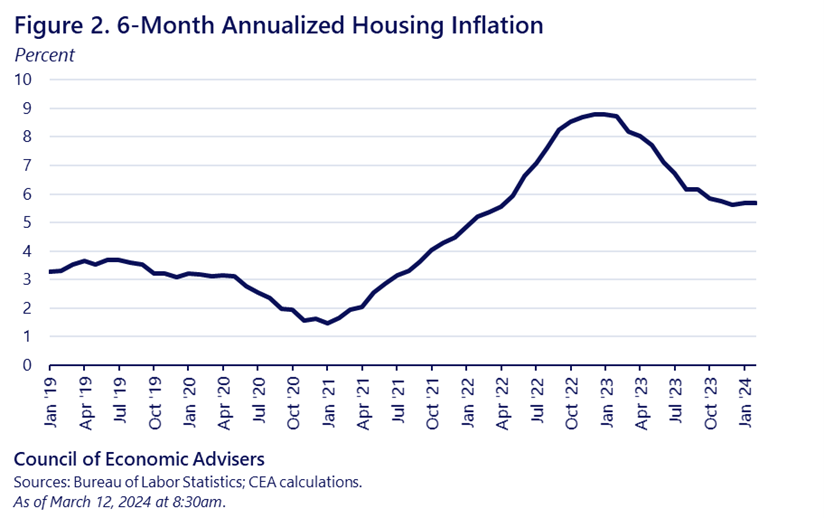
Housing: Housing is heavily weighted in the CPI, accounting for over a third of the total index and around 45 percent of the core index. On a 6-month basis, housing inflation peaked at almost 9 percent in January of last year, before reversing course. Today’s report showed housing costs up 0.4 percent last month, down from 0.5 percent in January. The figure shows that housing inflation is significantly down from its peak but remains elevated relative to its pre-pandemic average.
It is well-understood that the U.S. housing market suffers from a long-term supply shortfall relative to demand. President Biden’s FY 2025 budget, released yesterday, has a large and ambitious slate of policies to significantly boost housing affordability—both for renters and homeowners—and most importantly, the stock of affordable housing.
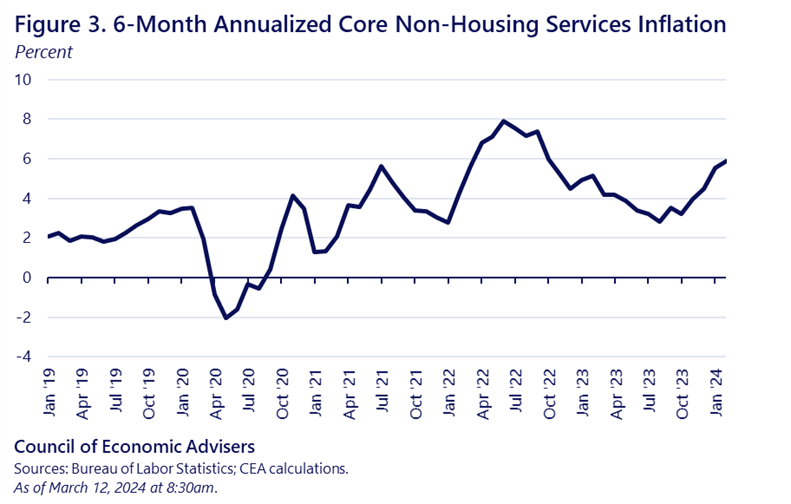
Non-housing services (NHS): This next category, also called core services less housing, captures the rest of the core inflation market basket (its weight is about 26 percent of the overall CPI and about 33 percent of the core). Because services are more labor intensive than the other two categories of core inflation we’ve discussed, inflationary pressures in this category are thought to be more sensitive to wage growth (CEA has examined this relationship in some detail). As the job market has cooled, nominal wage growth has slowed, which should help ease pressures of those NHS categories that are more wage sensitive (importantly, inflation has fallen faster than wage growth, implying real wage gains). On the other hand, inflation in less wage sensitive sectors in this category (e.g., medical care services and airfares) has put upward pressure on this subindex in recent months.
Last month NHS inflation was 0.5 percent, down from 0.8 percent in January. On a six-month basis, after falling from 8 percent in June 2022 to around 3 percent in August 2023, Figure 3 shows that the series has accelerated and, unlike core goods, is contributing to higher inflation.
As noted, these three categories make up core inflation. To get to headline inflation, we need to add in food and energy. While energy in general and retail gas in particular has put downward pressure on the overall index recently, in February, the gas price contributed 12 basis points to the monthly inflation rate, after subtracting from monthly inflation over the prior four months.
Food inflation has come down significantly for groceries and less so for restaurants. Grocery inflation was zero last month, compared to 0.4 percent in January. In February of 2022 and 2023, 6-month annualized grocery inflation was 12.2 and 5.6 percent, respectively. The comparable figure in February 2024 was 1.6 percent. Over the past year, grocery prices are down for pork, chicken, seafood, eggs, milk, coffee, and butter.
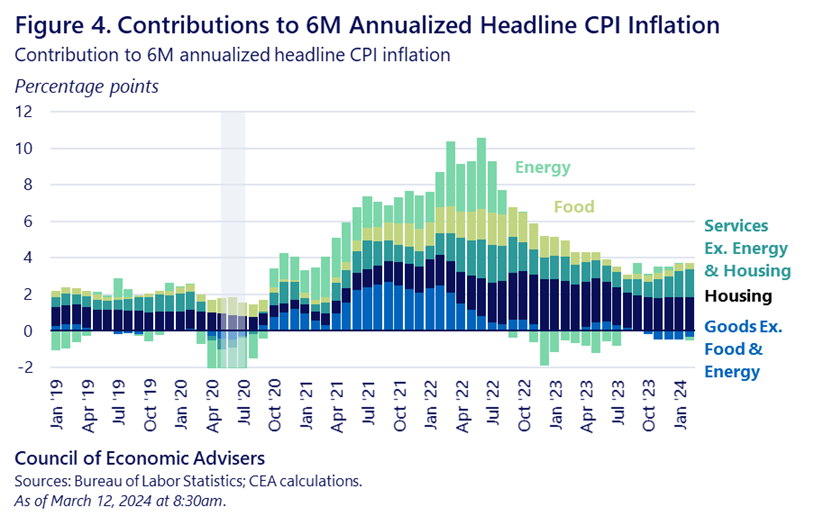
Figure 4 puts all these categories together, showing the contribution of each to the 6-month annualized growth rate. The figure shows that food, goods, and energy prices have contributed significantly to disinflation, while housing and NHS inflation have yet to consistently do so.
CEA will continue to get under the hood of inflation reports as the Biden-Harris Administration continues its work to lower costs on behalf of American consumers.