
An Update on Non-Housing Services Inflation
In a recent blogpost reviewing the latest CPI report, the CEA showed how one significant component of inflation, core services excluding housing (also known as “non-housing services,” or NHS), had recently accelerated. Given the broad decline in inflation—down about two-thirds from its peak in mid-2022—we wanted to take a closer look at what’s driving this apparent NHS acceleration and assess its prospective role in inflation’s future trajectory.
We find that the recent acceleration in NHS inflation is largely driven by unusual movements in the CPI’s measure of health insurance costs, about which two points are salient.[1] First, unlike most of the CPI, a big part of what’s moving this category has little to do with prices people pay for such services, and second, our expectation is that its contribution to inflation should significantly diminish after new data are incorporated in the April CPI data.[2]
As our recent post showed, a helpful decomposition is to divide core CPI inflation into three broad categories, shown in the table below. While core housing and goods are more self-explanatory, the NHS part of core inflation includes dozens of disparate sub-sectors, including utilities such as trash removal, medical care such as doctors visits, transportation such as car rentals, and personal services such as haircuts, among many others.
| Table 1. Core CPI Inflation, 6-Month Annualized Change | ||||
| Jun-2022 | Feb-2024 | |||
| Rate | Contribution | Rate | Contribution | |
| Total Core (100%) | 6.2 | — | 3.9 | — |
| Housing (43%) | 6.6 | 2.6 | 5.7 | 2.4 |
| Core Goods (24%) | 3.9 | 1.1 | -1.5 | -0.4 |
| Core Non-Housing Services (33%) | 7.9 | 2.6 | 5.9 | 1.9 |
Sources: Bureau of Labor Statistics, CEA calculations.
As of March 20, 2024 at 2pm.
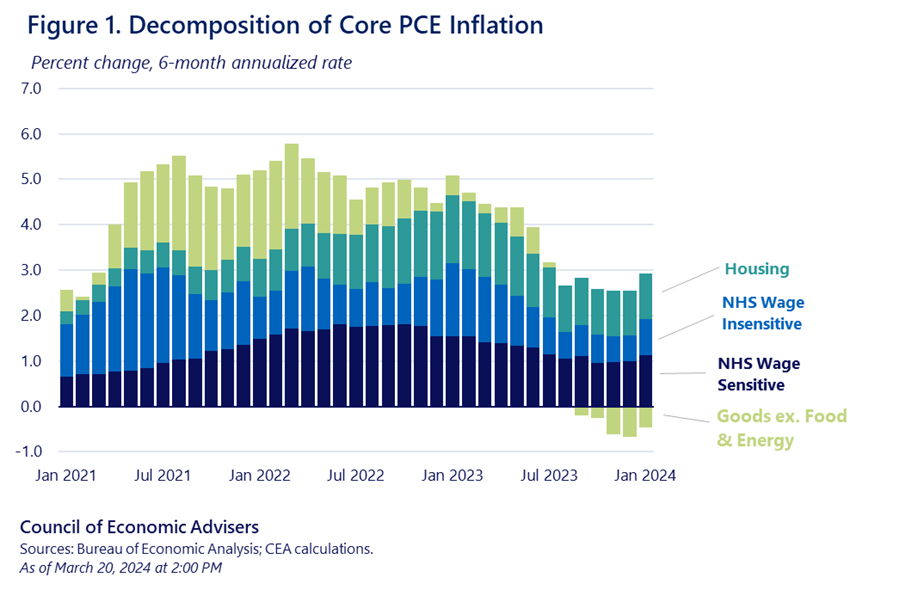
The table shows that while core non-housing services inflation contributed about 0.7 percentage point less to core inflation (1.9 – 2.6) in February 2024 than it did in June 2022, inflation in that category remains elevated. Earlier CEA work suggested that because services tend to be more labor intensive than the other two sectors, the NHS inflation trajectory would depend in part on the cooling labor market, particularly for the sub-sectors we identified as “wage sensitive.”[3] The figure below shows that while PCE inflation in wage sensitive sub-sectors has eased from its peak, in recent months, its contribution has flattened.
But there is something else of note going on within NHS that partially drives the recent acceleration: the way in which the CPI measures the cost of health insurance. Figure 2 shows extreme volatility in this part of the index. Instead of reflecting actual jumps in costs, these sharp ups and down reflect the way BLS measures this cost.
Typically, the CPI measures the direct retail costs to consumers of goods and services. Doing so for health insurance is tricky because premiums paid to health insurers partially reflect prices paid by health insurers to doctors, hospitals, and pharmacies, meaning the BLS must split premiums into medical services provided vs. health insurance services provided. So, the BLS uses an “indirect” measure that infers the costs of health insurance services from health insurers’ retained earnings—premiums received minus benefits paid out to providers. The data on retained earnings, however, are measured only with a substantial lag, and so the health insurance portion of the CPI doesn’t necessarily reflect real-time costs of health insurance to consumers. Note that this measurement challenge was particularly acute during COVID when health services consumption fell dramatically, leading to a sharp increase in premiums received minus benefits paid, even without a corresponding increase in premium levels.[4]
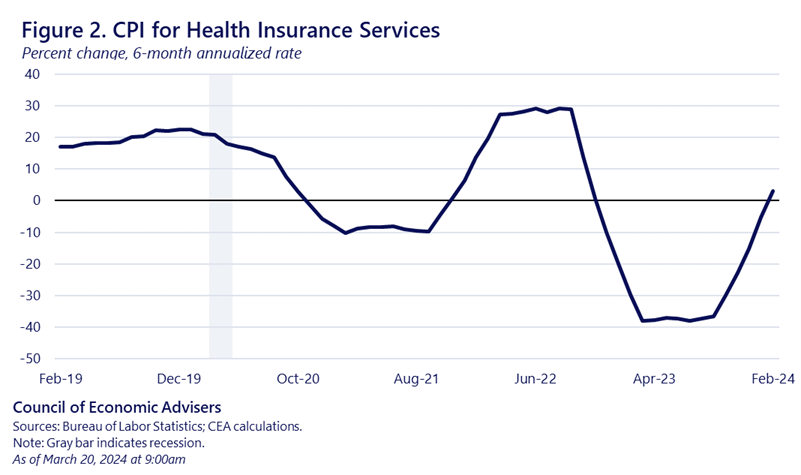
Figure 3 shows 6-month annualized inflation of NHS with and without the health insurance component. The latter series (light blue) shows less decline through the first half of 2023 and then less acceleration since the latter half of 2023.
Another factor behind the recent NHS acceleration is airfares. This is also a volatile category, and one of many in the core CPI that reflects a pass-through of energy prices to consumers. In this sense, it is less reflective of true “core” inflationary indices which are designed to omit volatile energy costs. When we take both health insurance and airfares out of NHS inflation (green line), we see that while NHS inflation remains elevated, its recent acceleration is further diminished.[5]
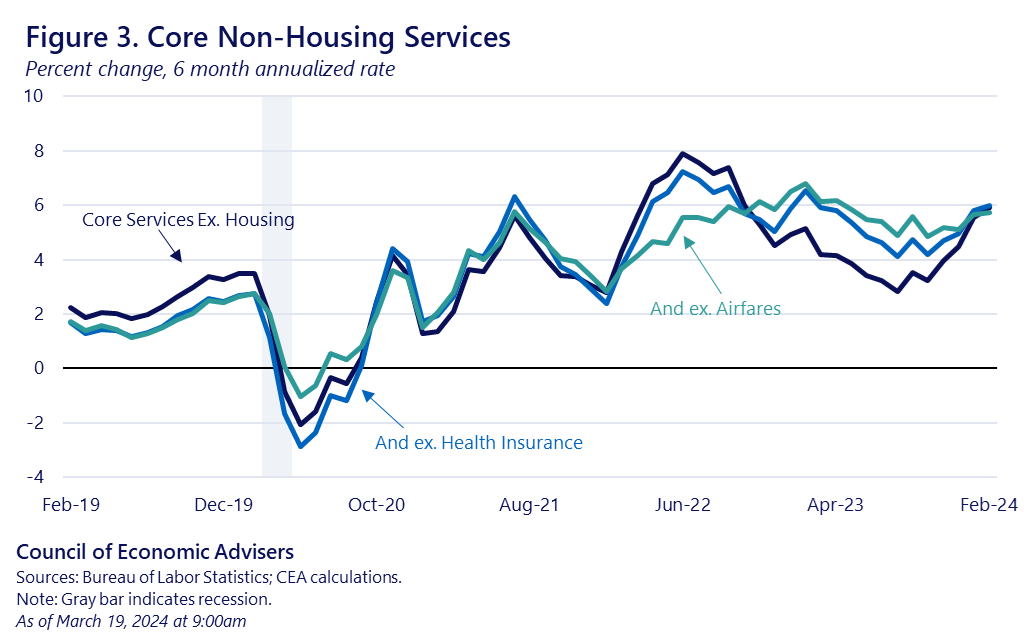
While NHS inflation excluding health insurance and airfares peaked at about 6.8%—substantially lower than the 7.9% peak of overall NHS inflation—it has only slowly edged down, reaching 5.8% in February 2024 (roughly similar to overall core NHS). We expect that as labor market pressures continue to cool, while maintaining low unemployment, and as health insurance costs are updated, this component should ease as well. In any event, CEA will continue to track and report on this and all other factors impacting inflation.
[1] Since 2020, the standard deviation of the annualized 6-month growth rate of health insurance services is three times higher than in the pre-COVID period.
[2] This expectation is based on CEA’s rough replication of the BLS’s methodology for incorporating retained earnings data from the National Association of Insurance Commissioners (NAIC). CEA analyzed the most recent report from NAIC with data through the first half of 2023 which will be incorporated into the CPI with the release of the April data.
[3] Wage-sensitive sub-sectors are those whose prices that are positively and significantly correlated with wage growth, as explained here.
[4] According to data from the National Association of Insurance Commissioners, health care utilization has rebounded from the lows of COVID and remained somewhat above pre-pandemic levels through 2022, the last year of available data.
[5] Note that health insurance and airfares together comprise only 1.7 percent of the core CPI basket. Core services excluding housing, health insurance, and airfares make up about 33 percent of the core CPI.